 updates that drive your success!
Until now, retiring an app you no longer use meant deleting it outright — and deleting it took its whole subscription and cost history down with it. So most admins just… didn’t. Dead apps piled up in the catalog purely so nobody lost the answer to “wait, what were we paying for that?”
Now there’s a cleaner way. Archiving lets you retire an app for good while keeping its cost record exactly where it is. Your active catalog stays tidy, your spend totals stay honest, and your historical “what did this used to cost us” answer is still one click away. Think of it as clearing the shelf without shredding the receipts.
How It Works
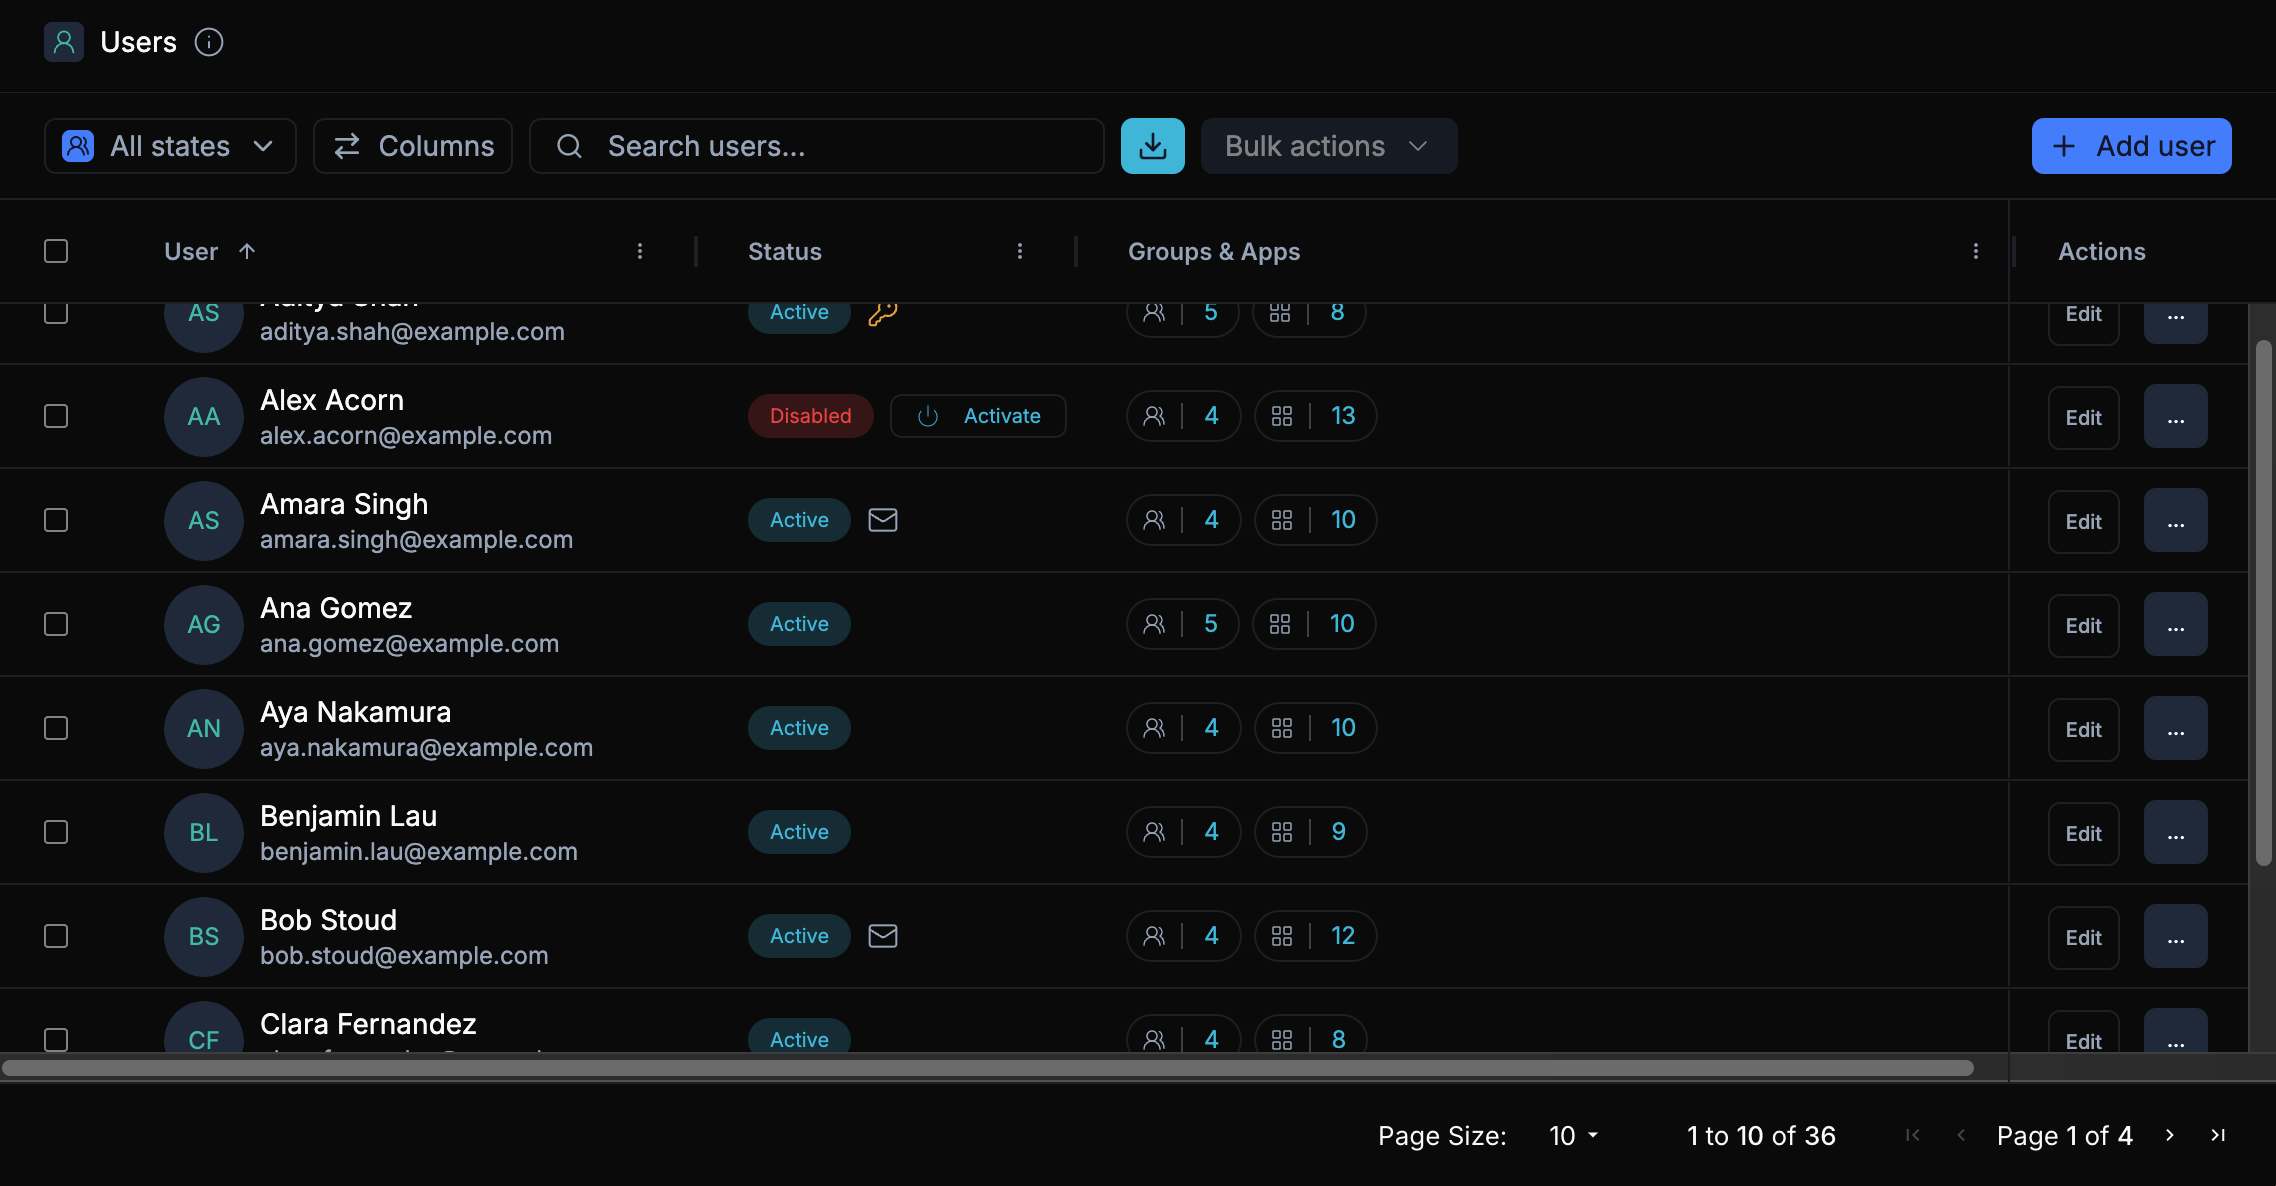
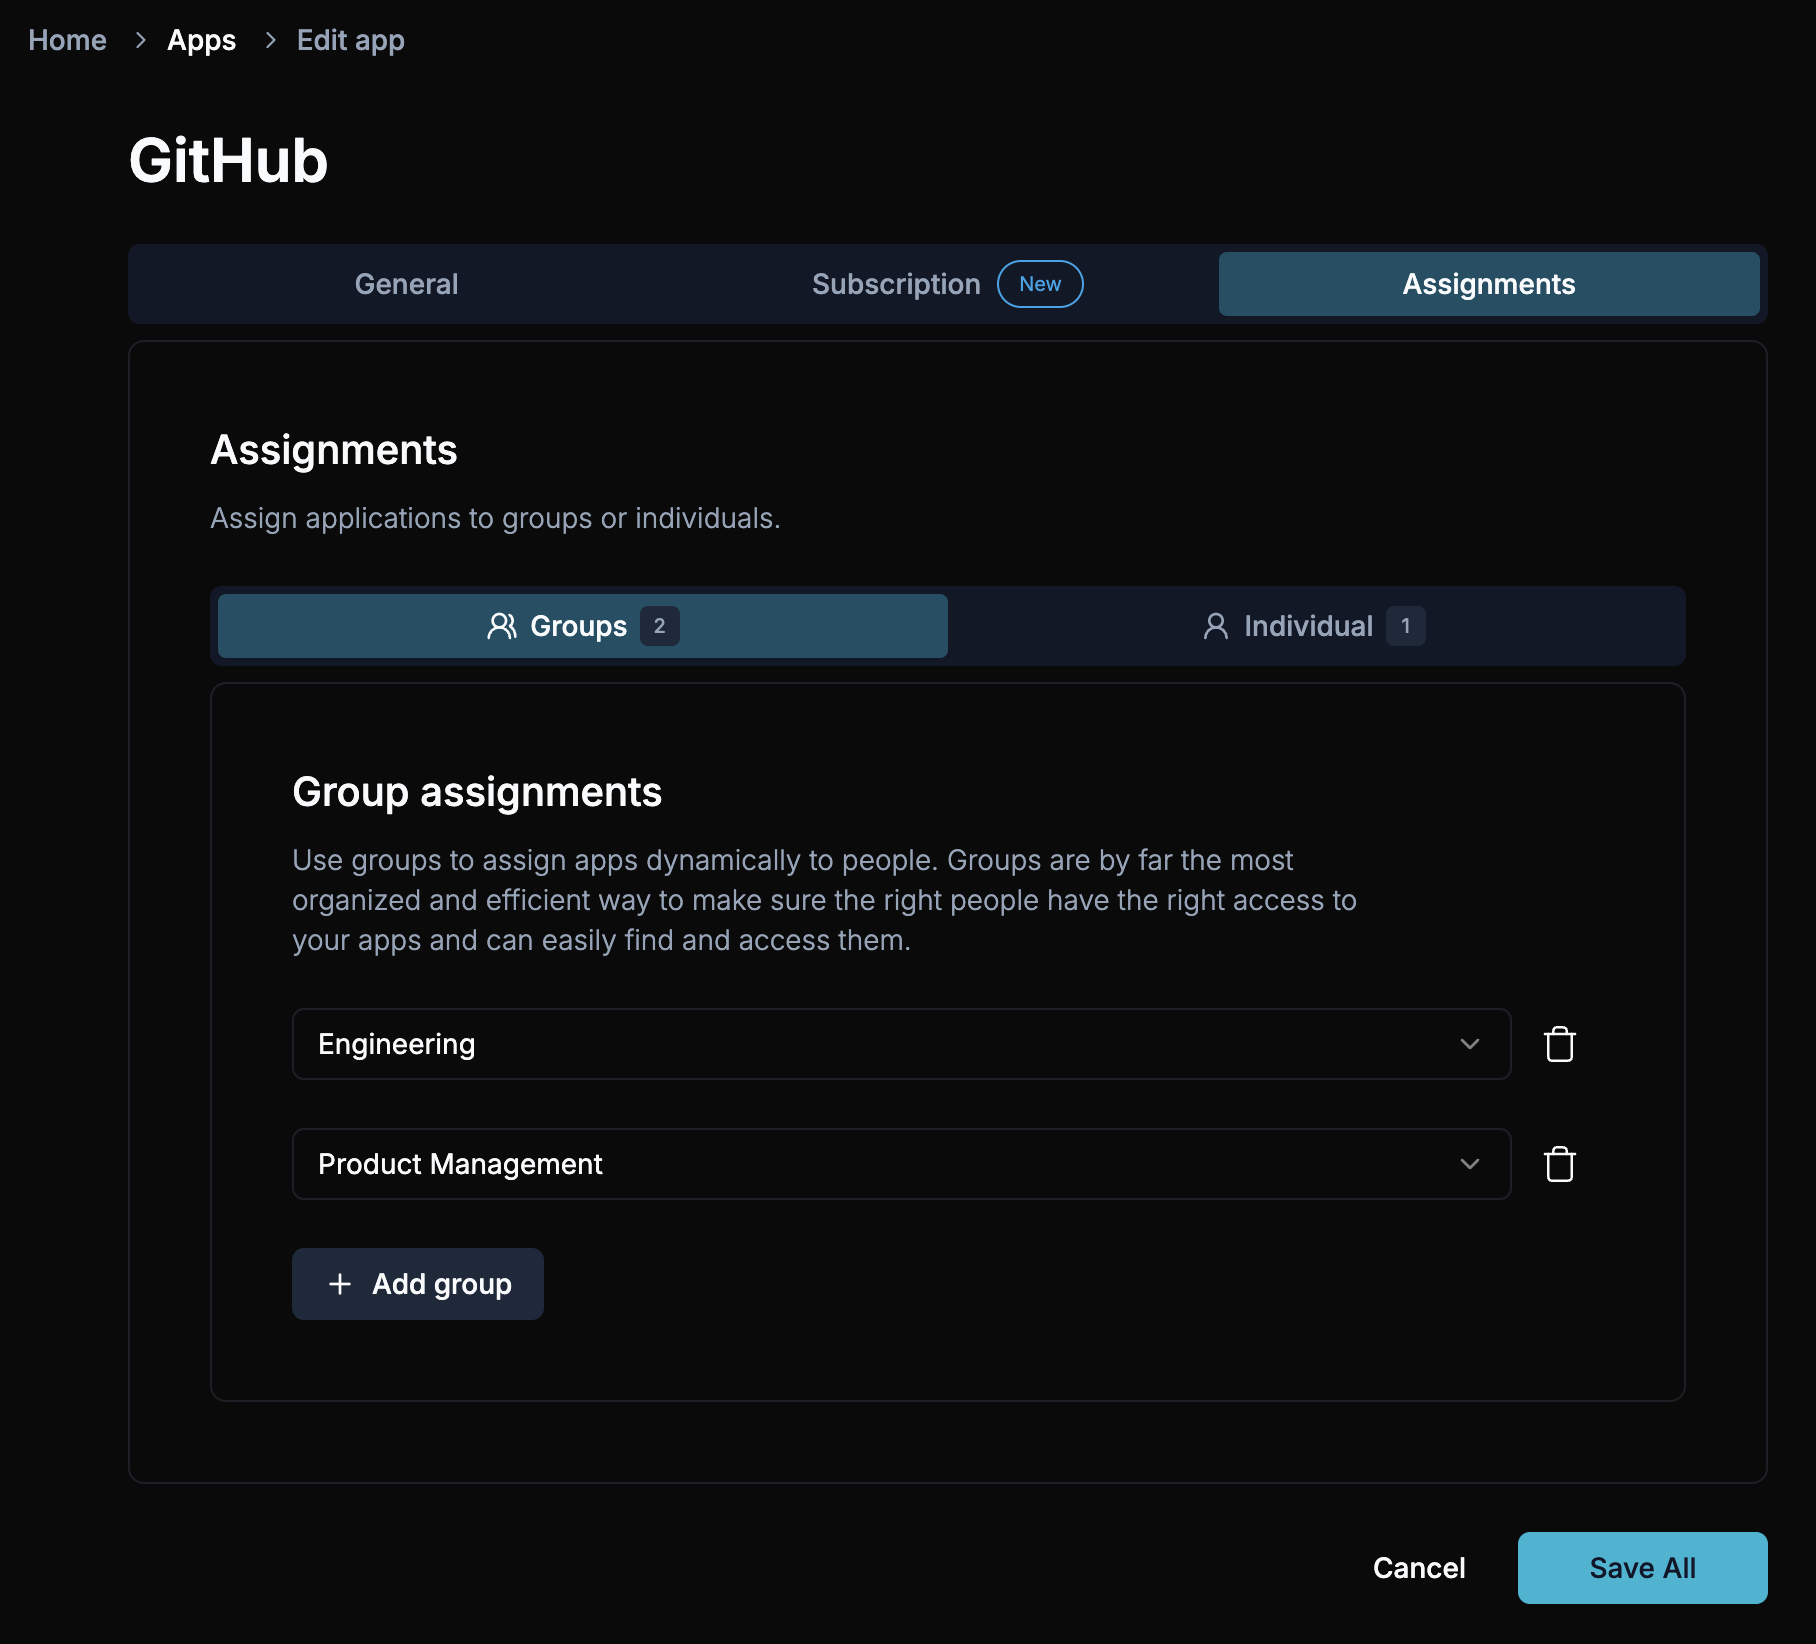
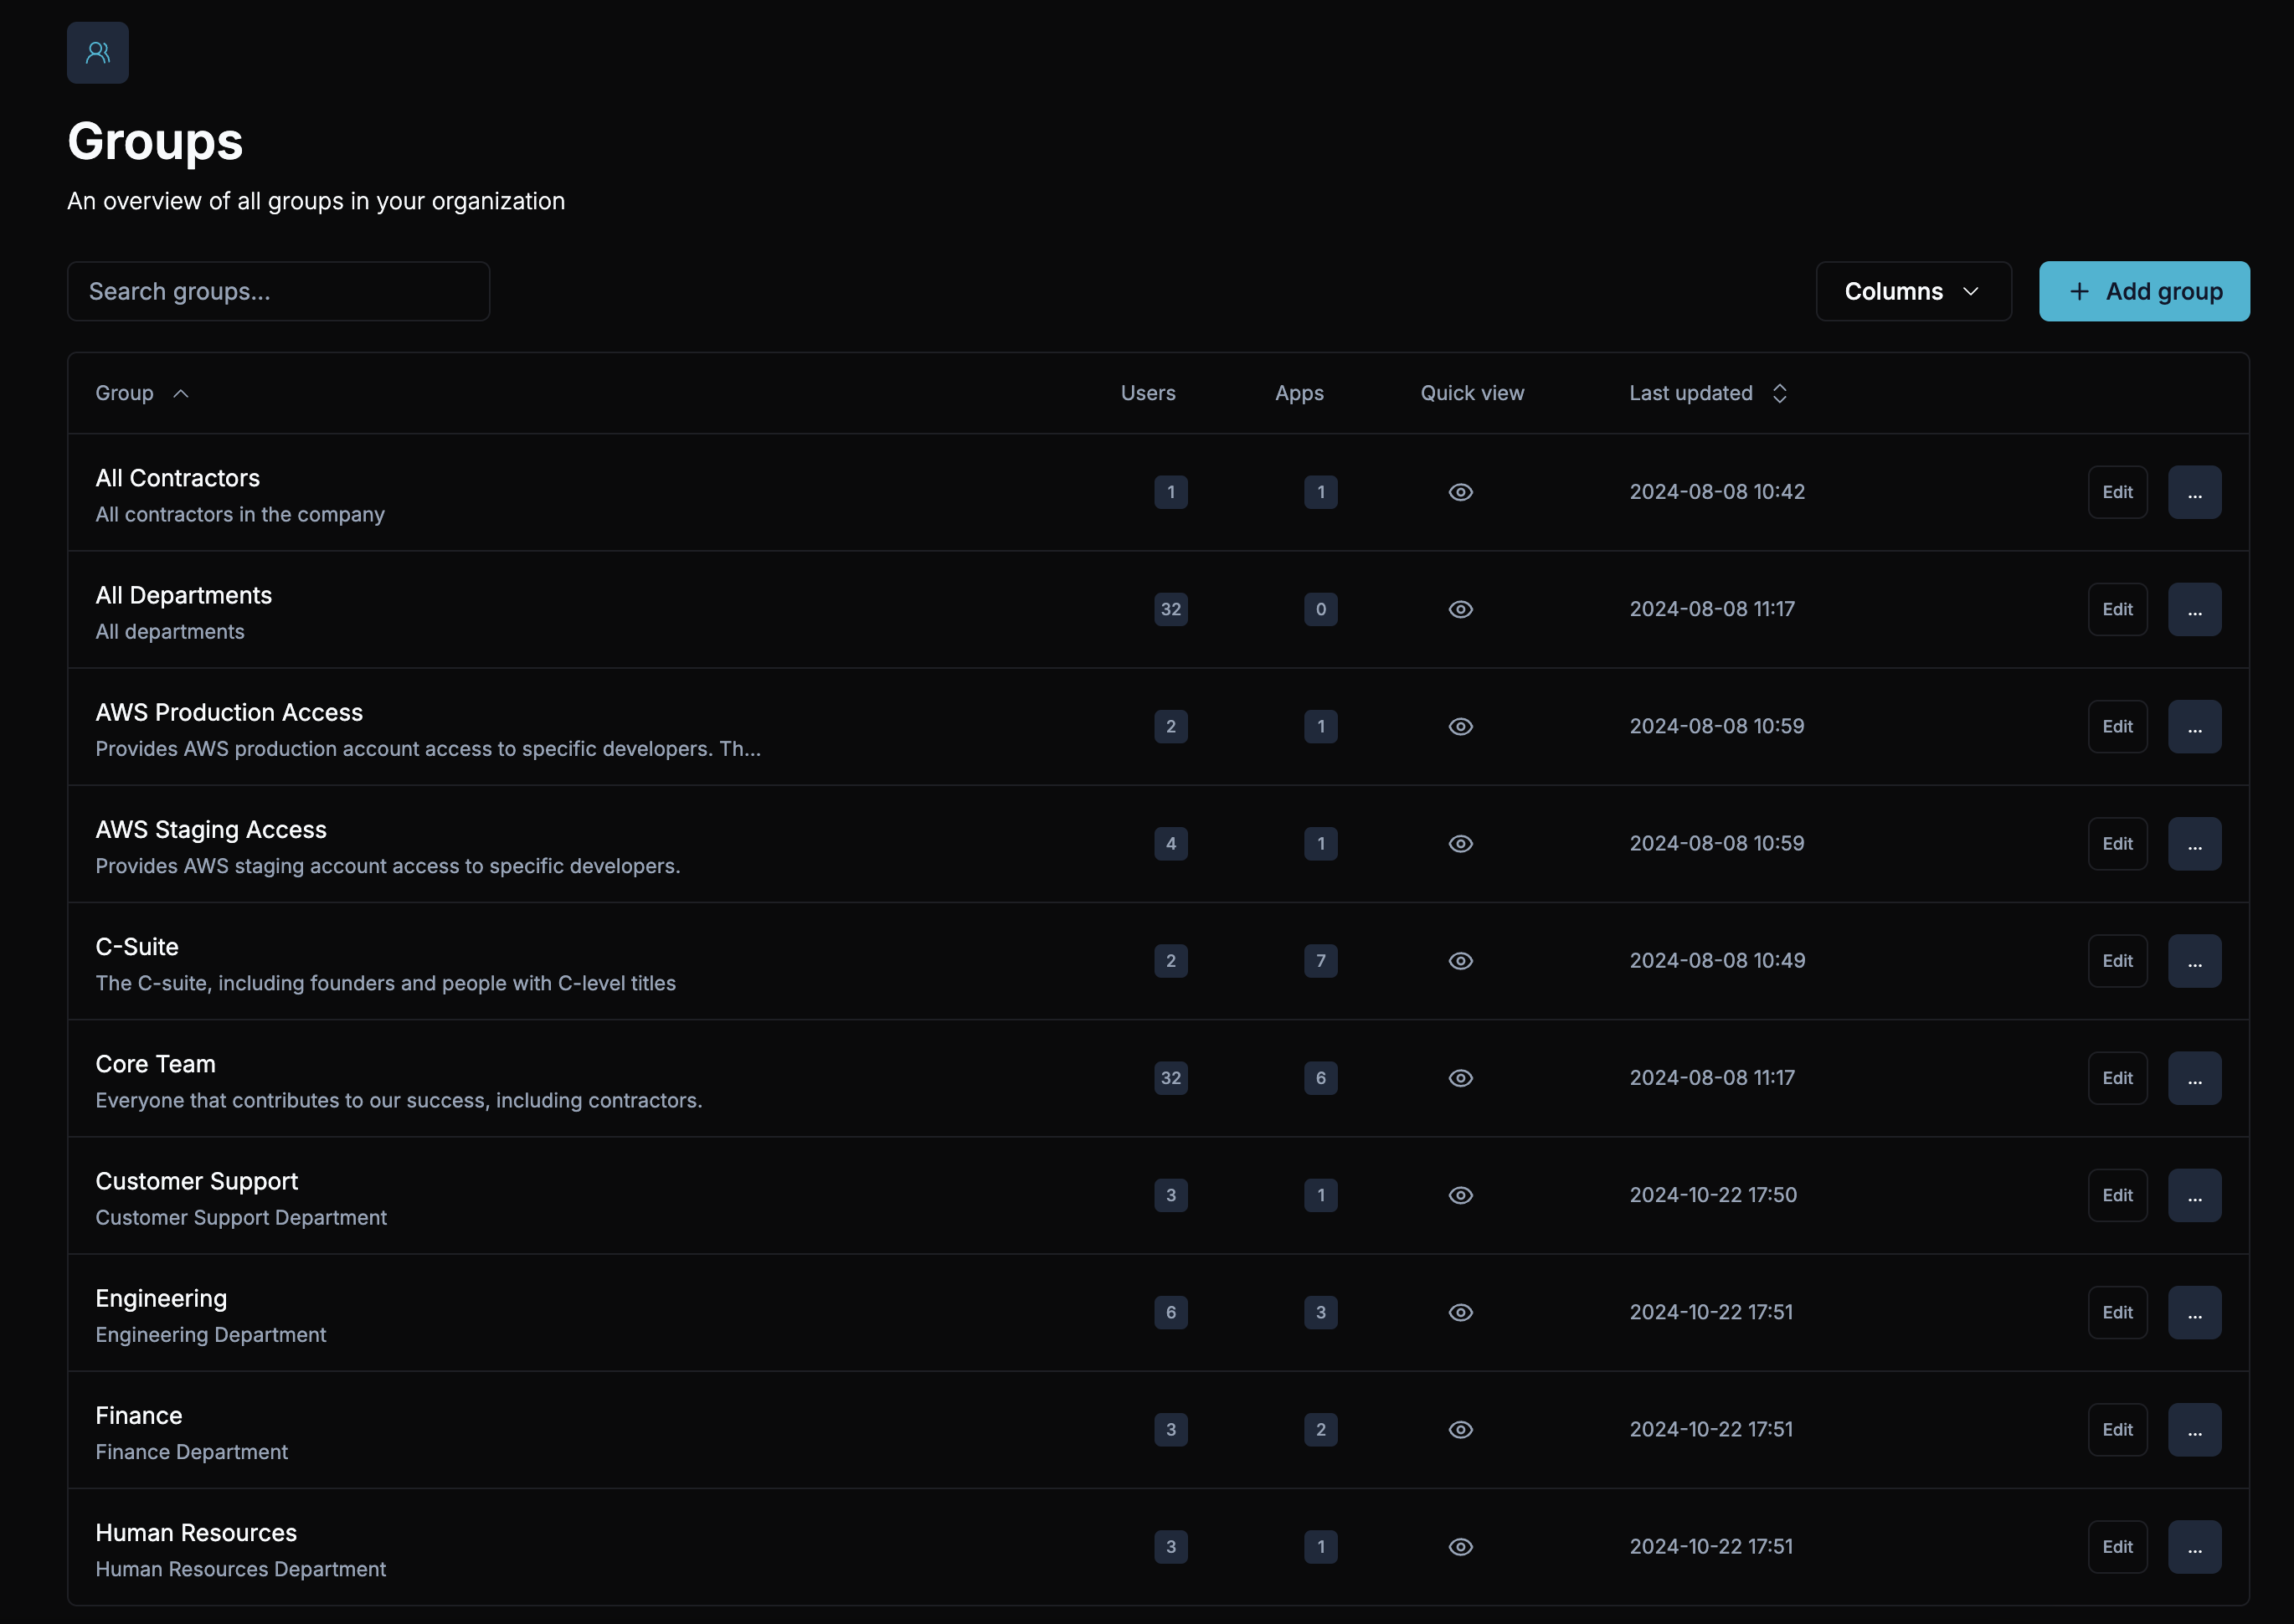
- The app steps out of the way. Archiving removes it from JumpCloud and pulls back its assignments, so it’s no longer live for anyone.
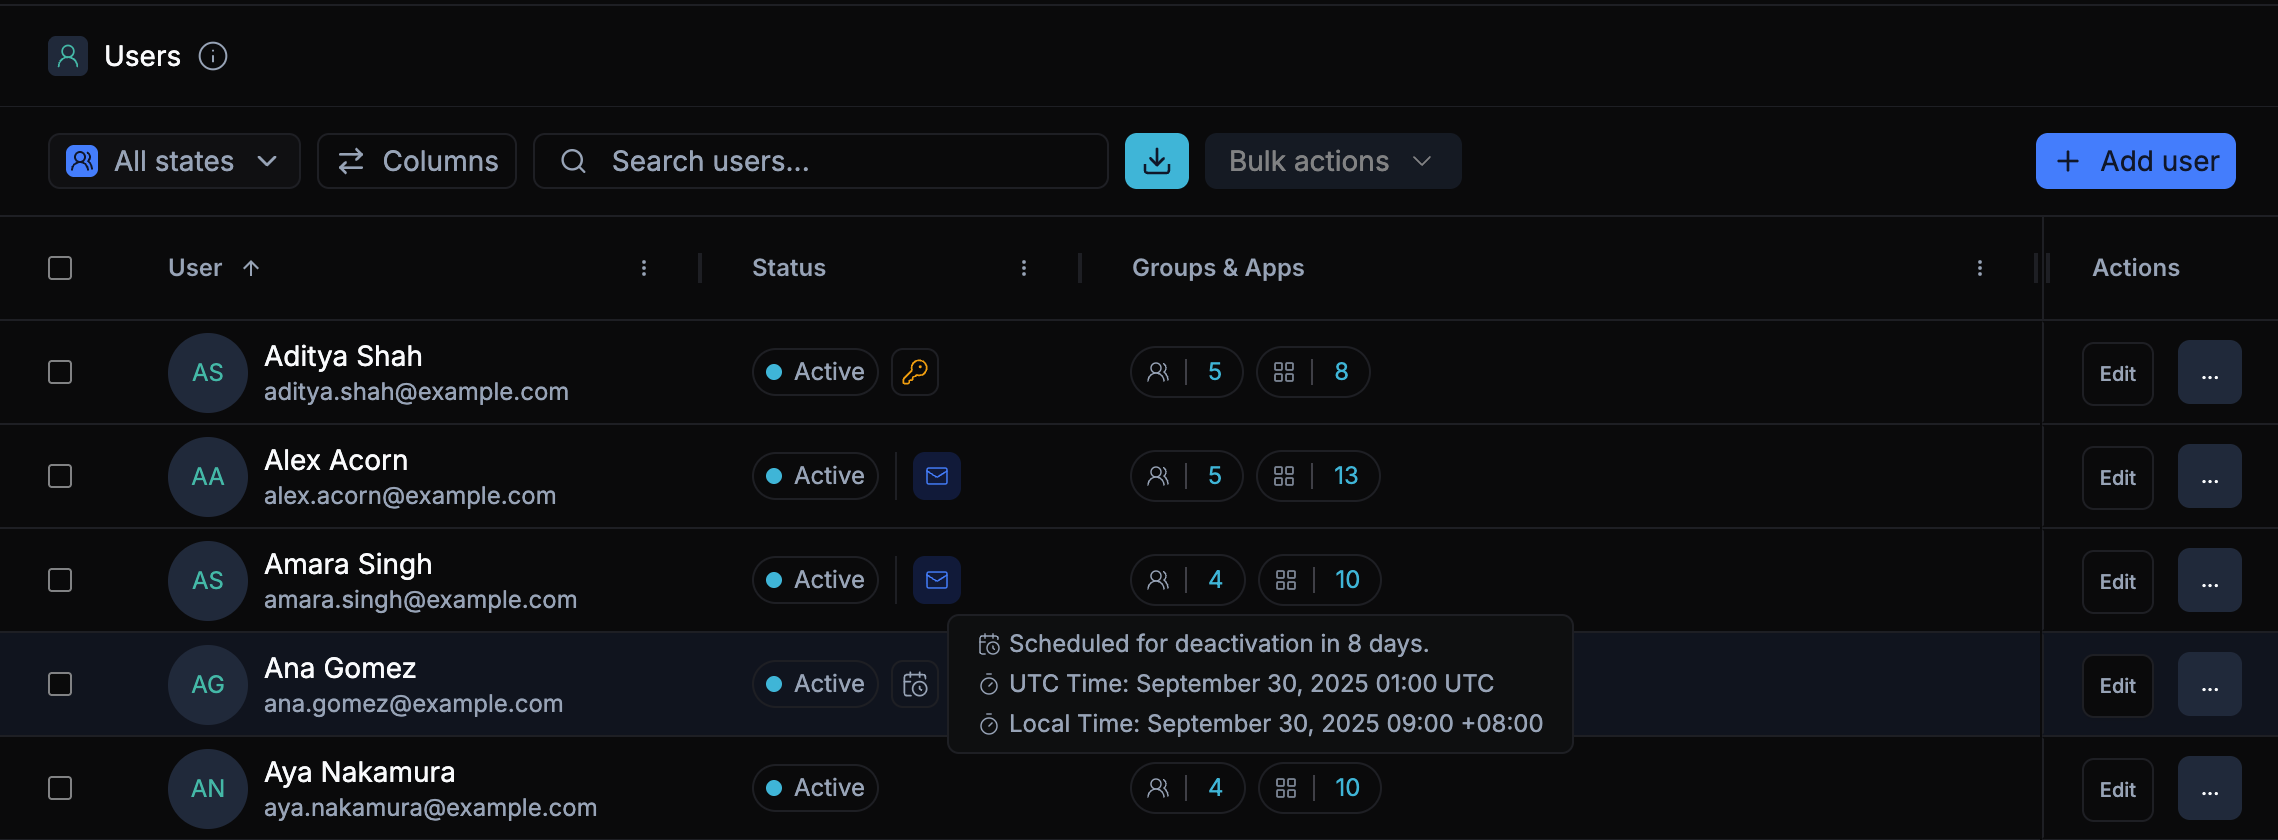
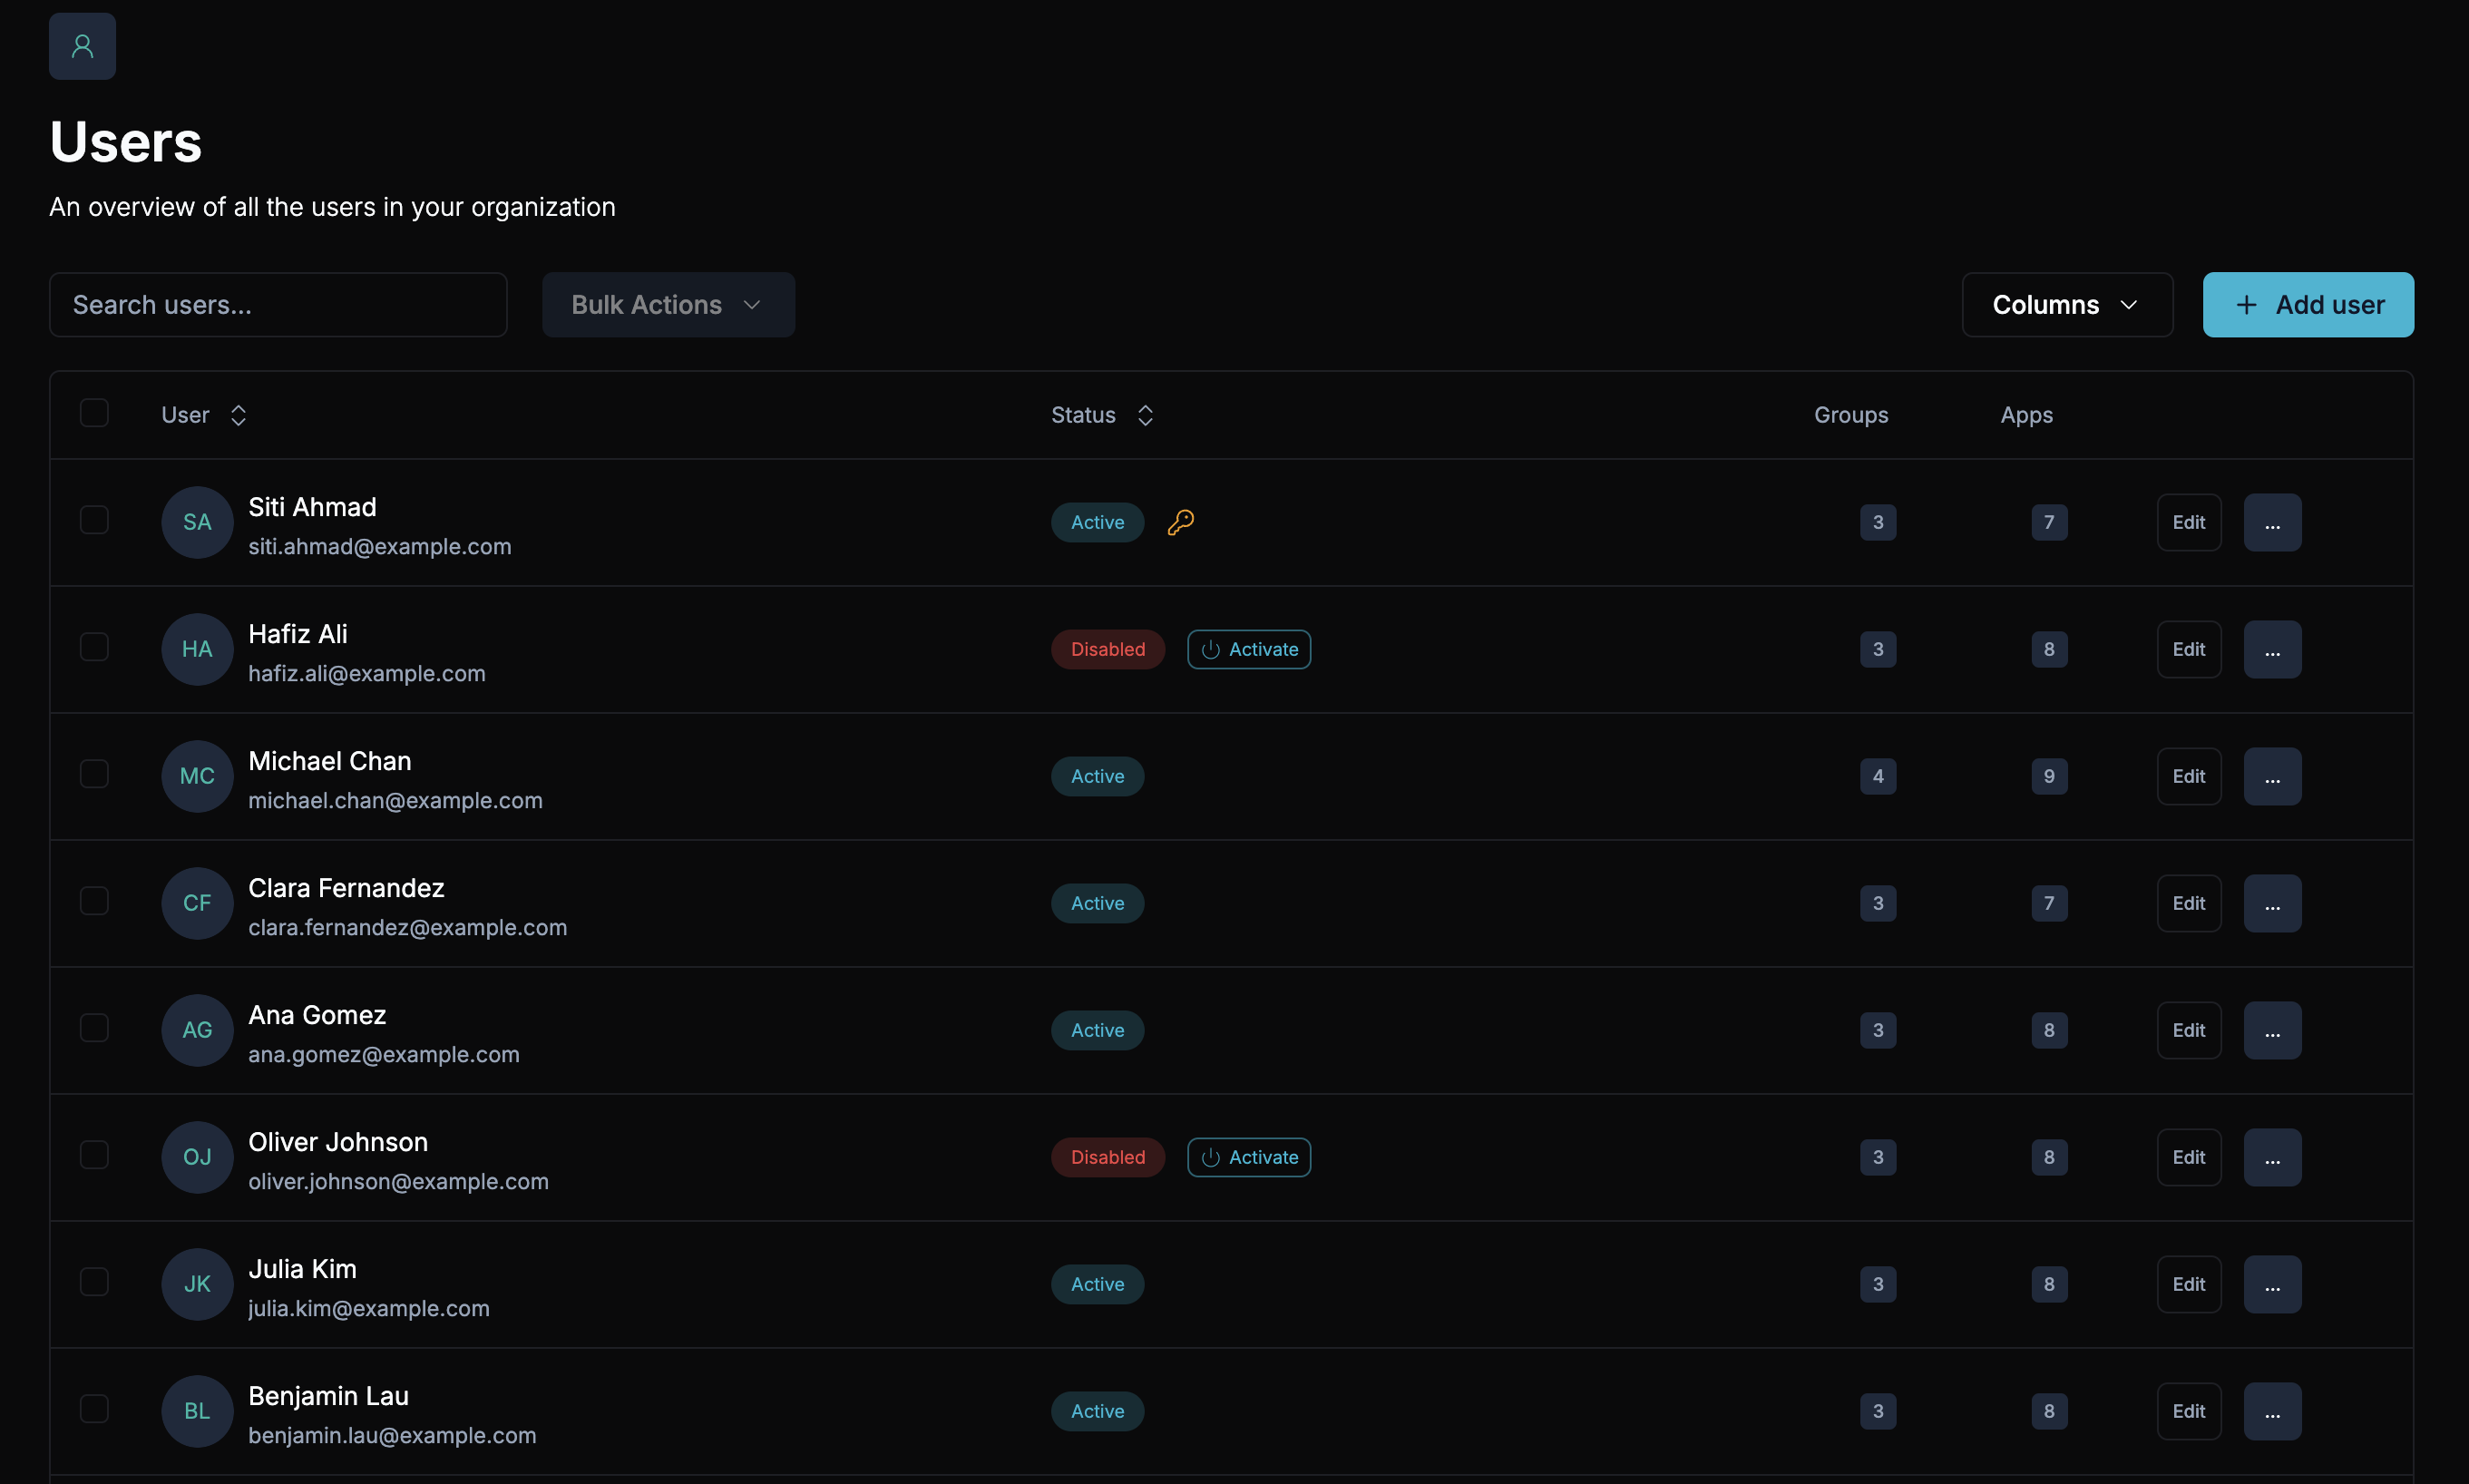
- Employees stop seeing it. Archived apps disappear from the app launcher — your team only sees what they actually use.
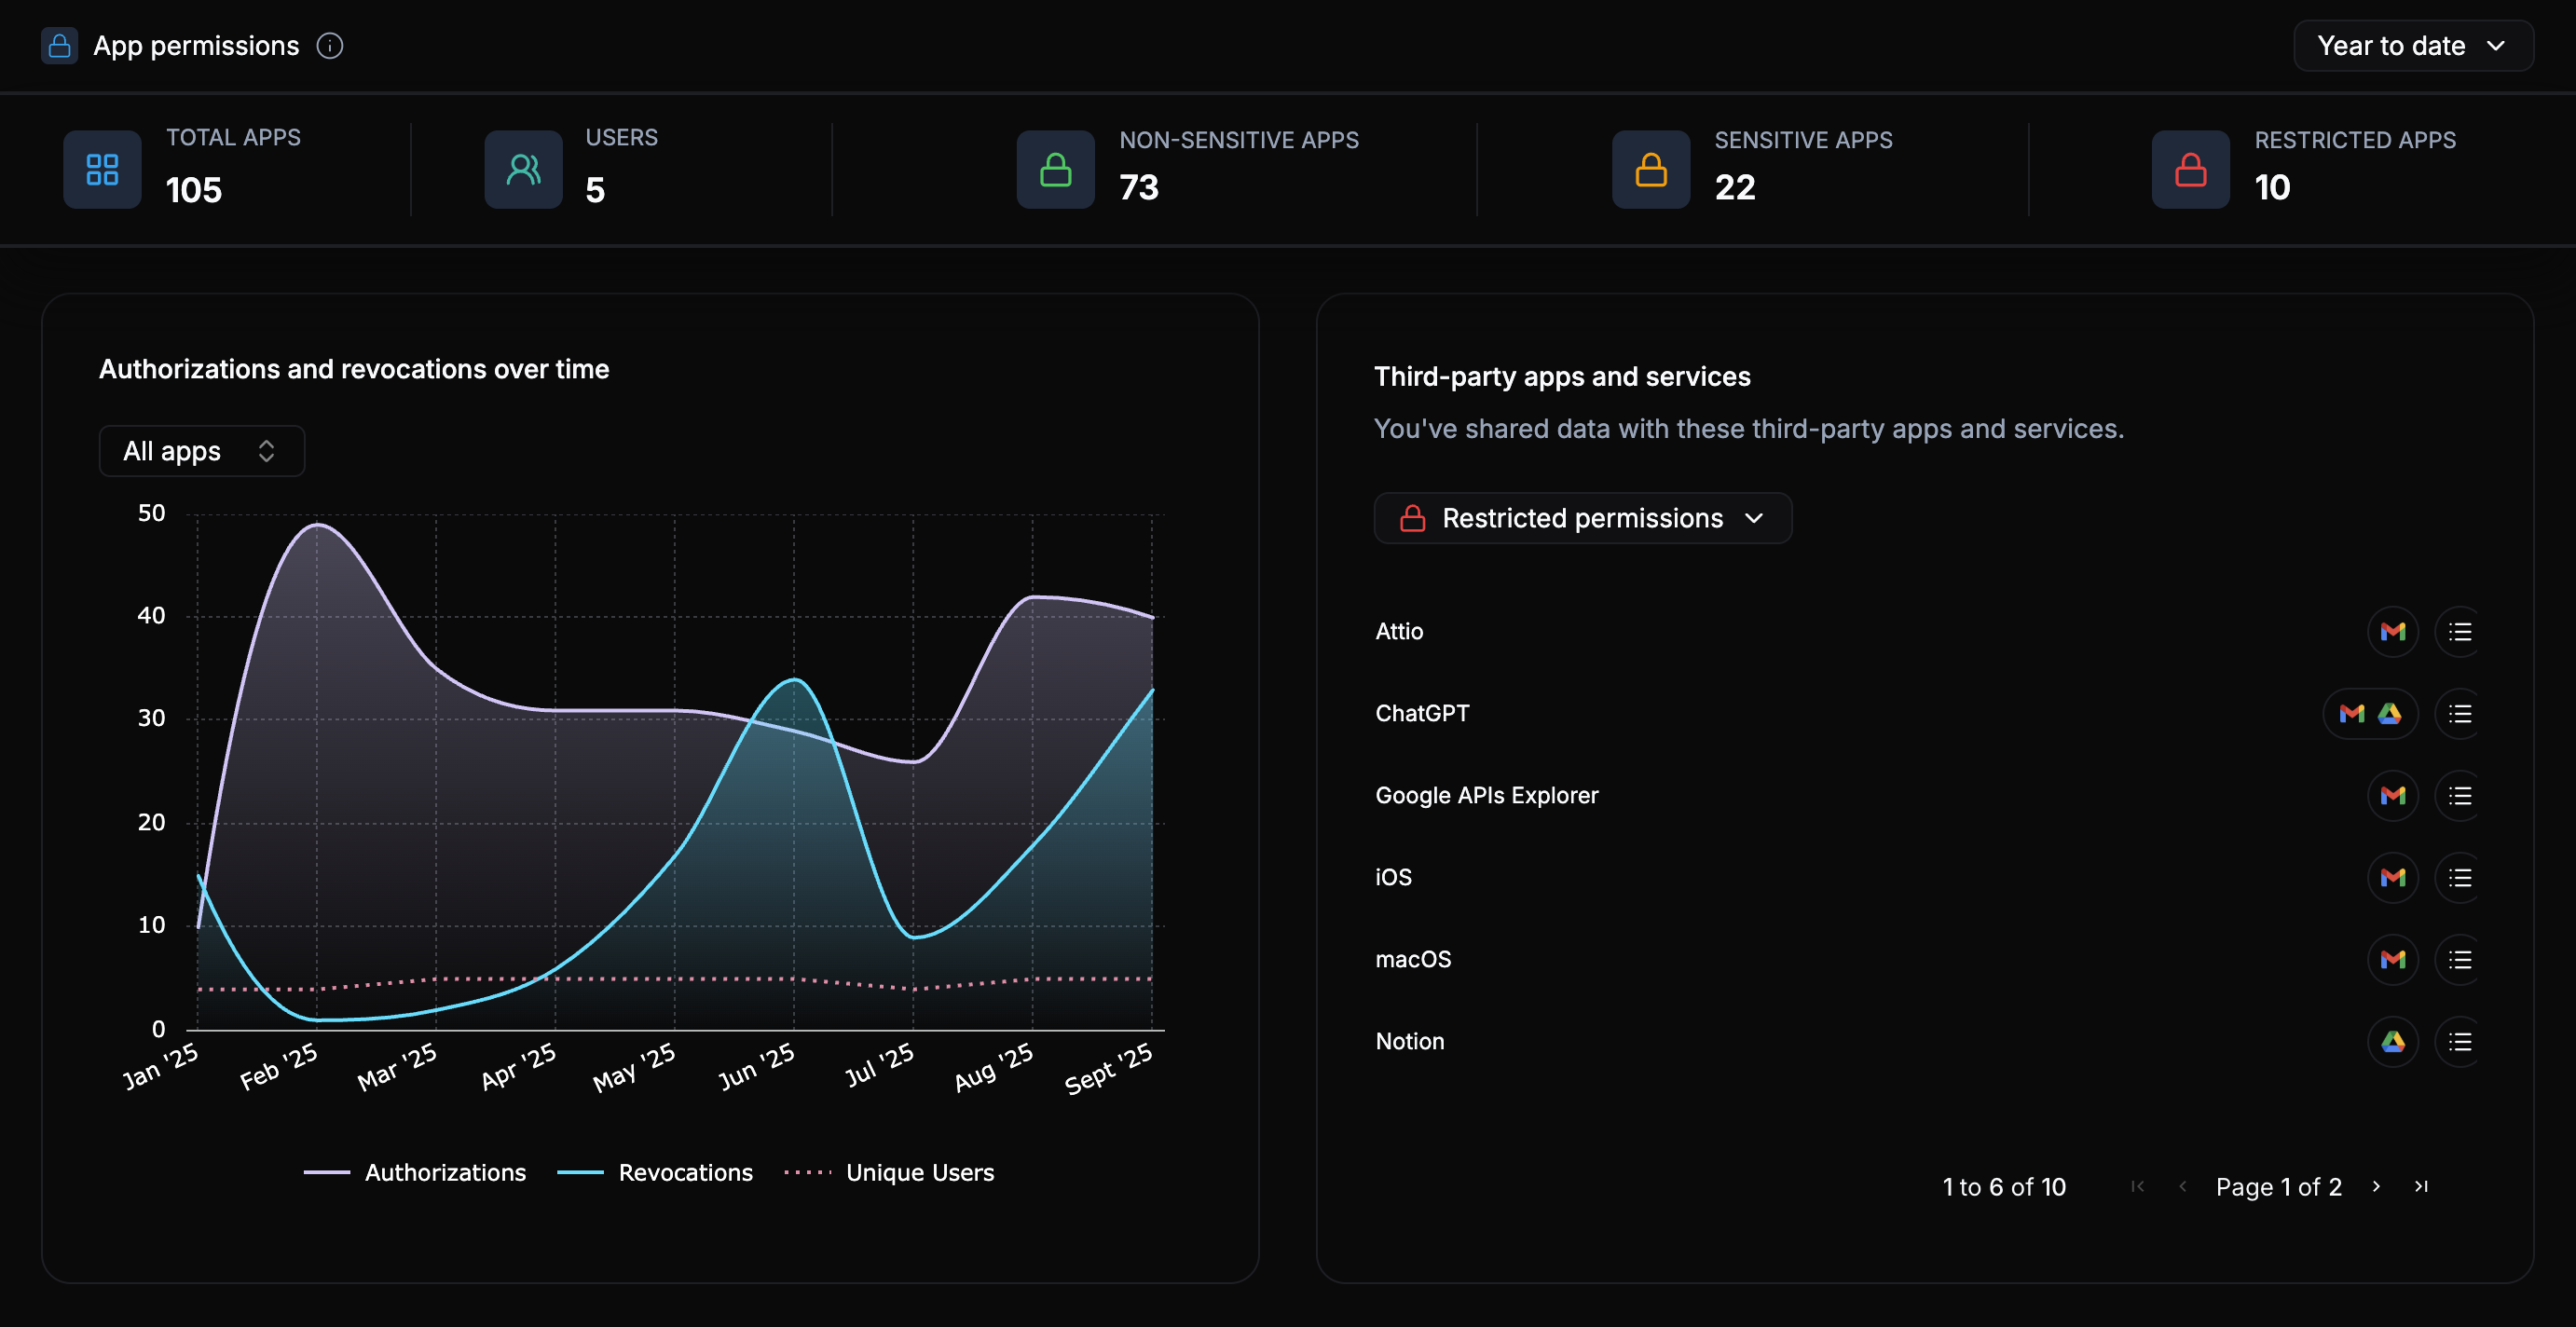
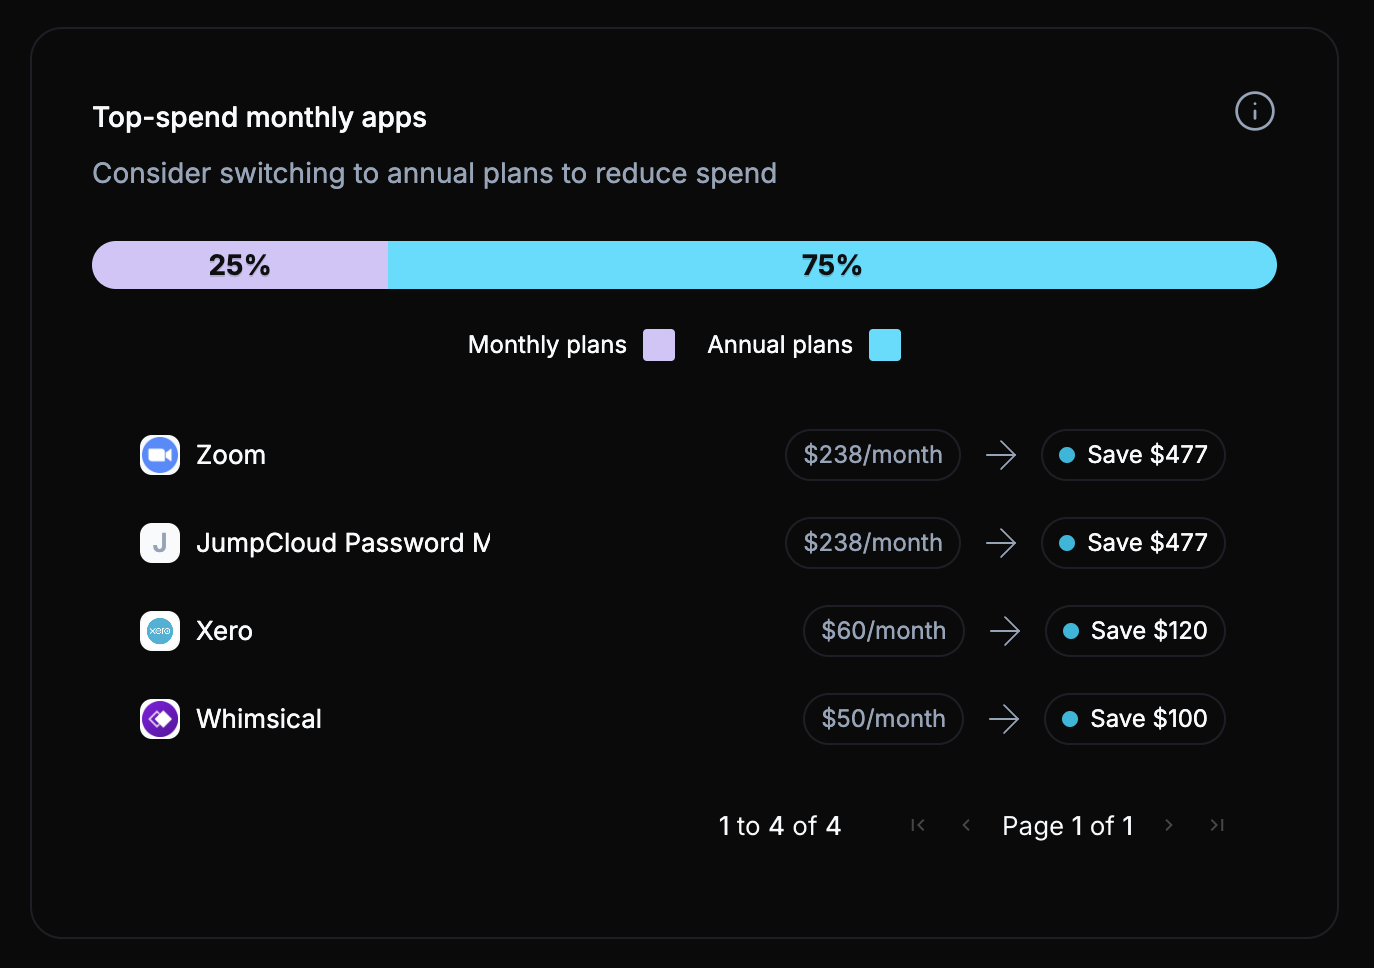
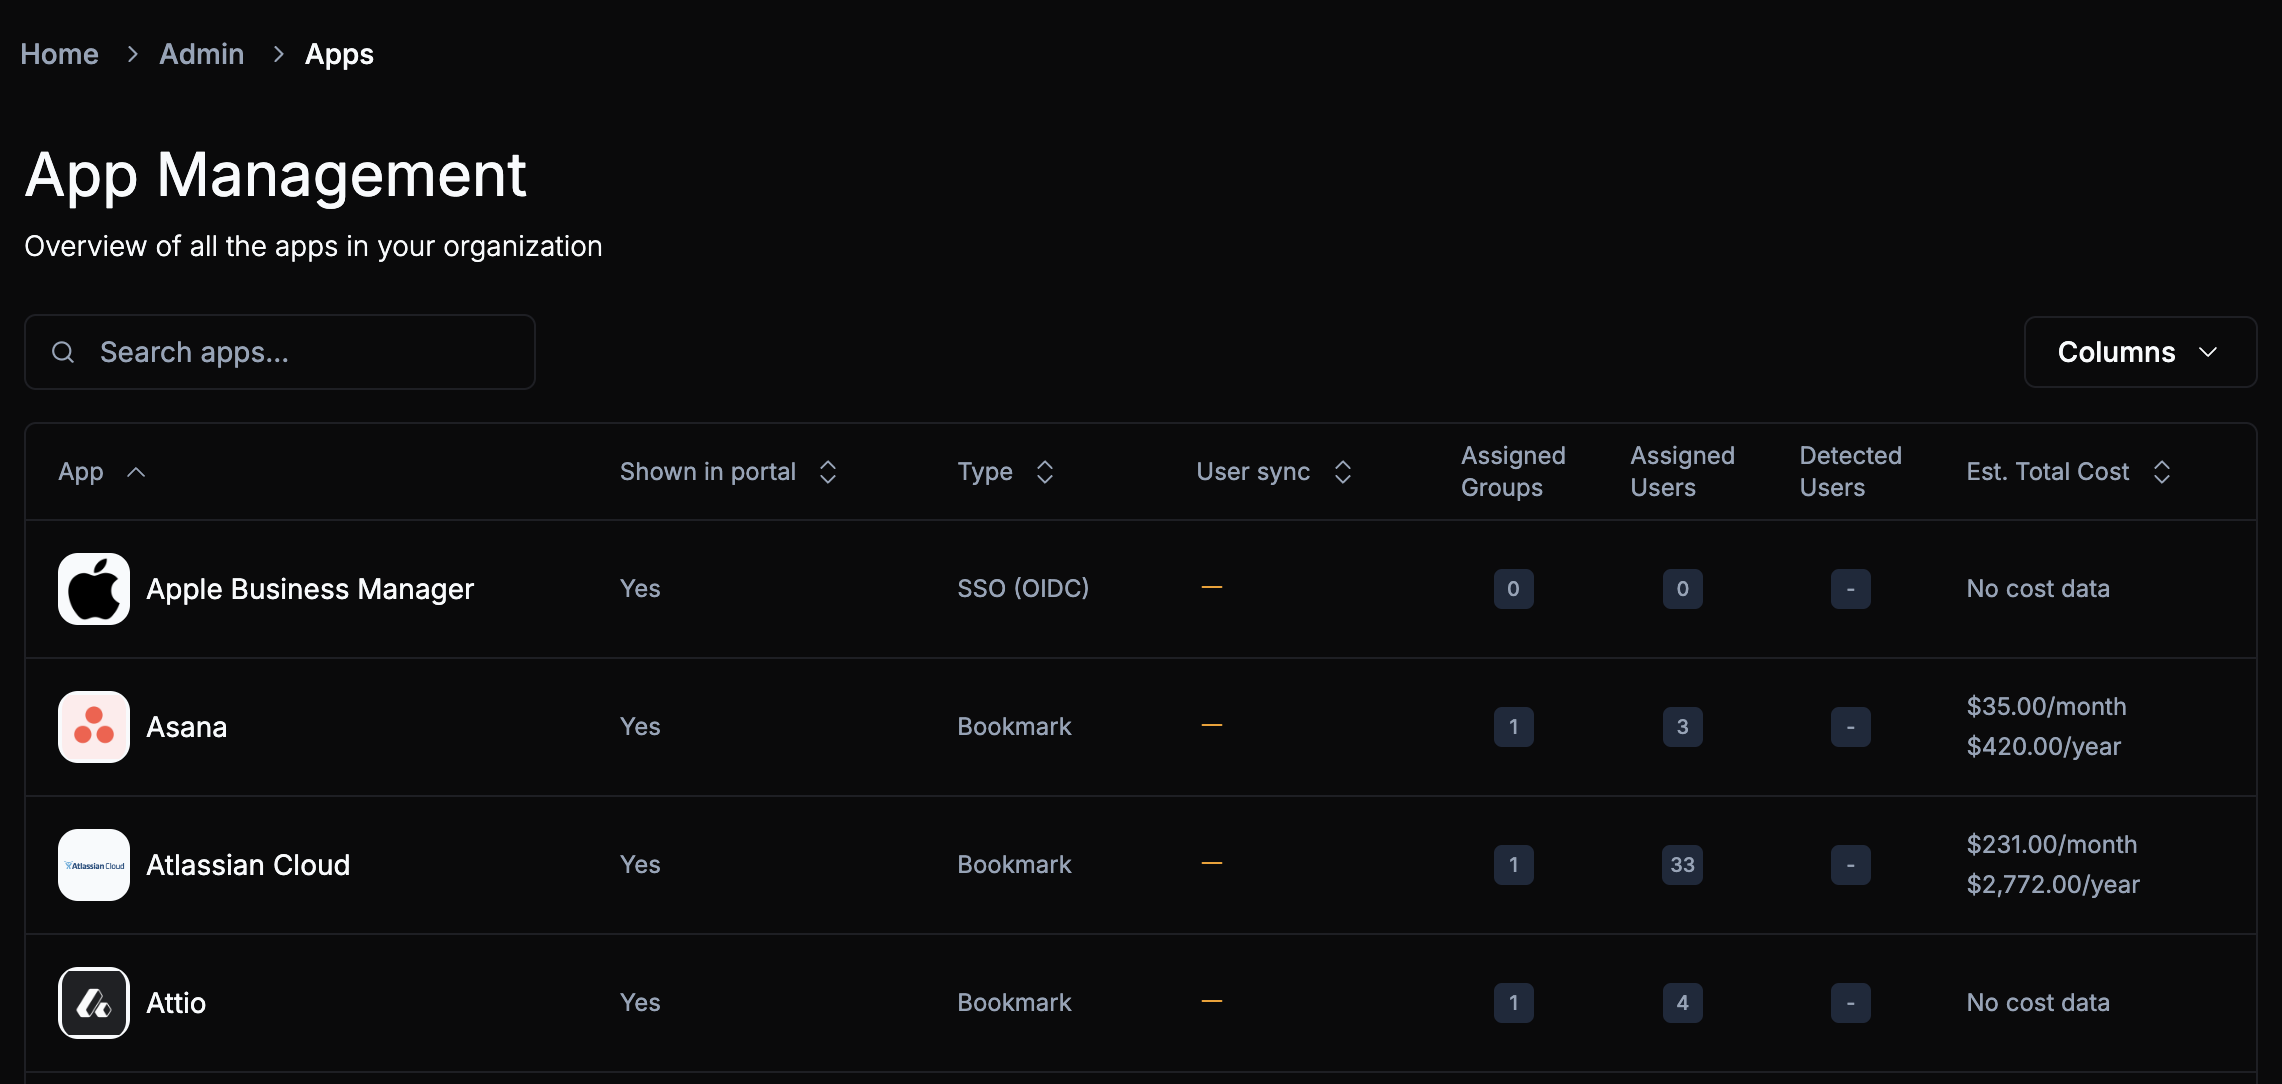
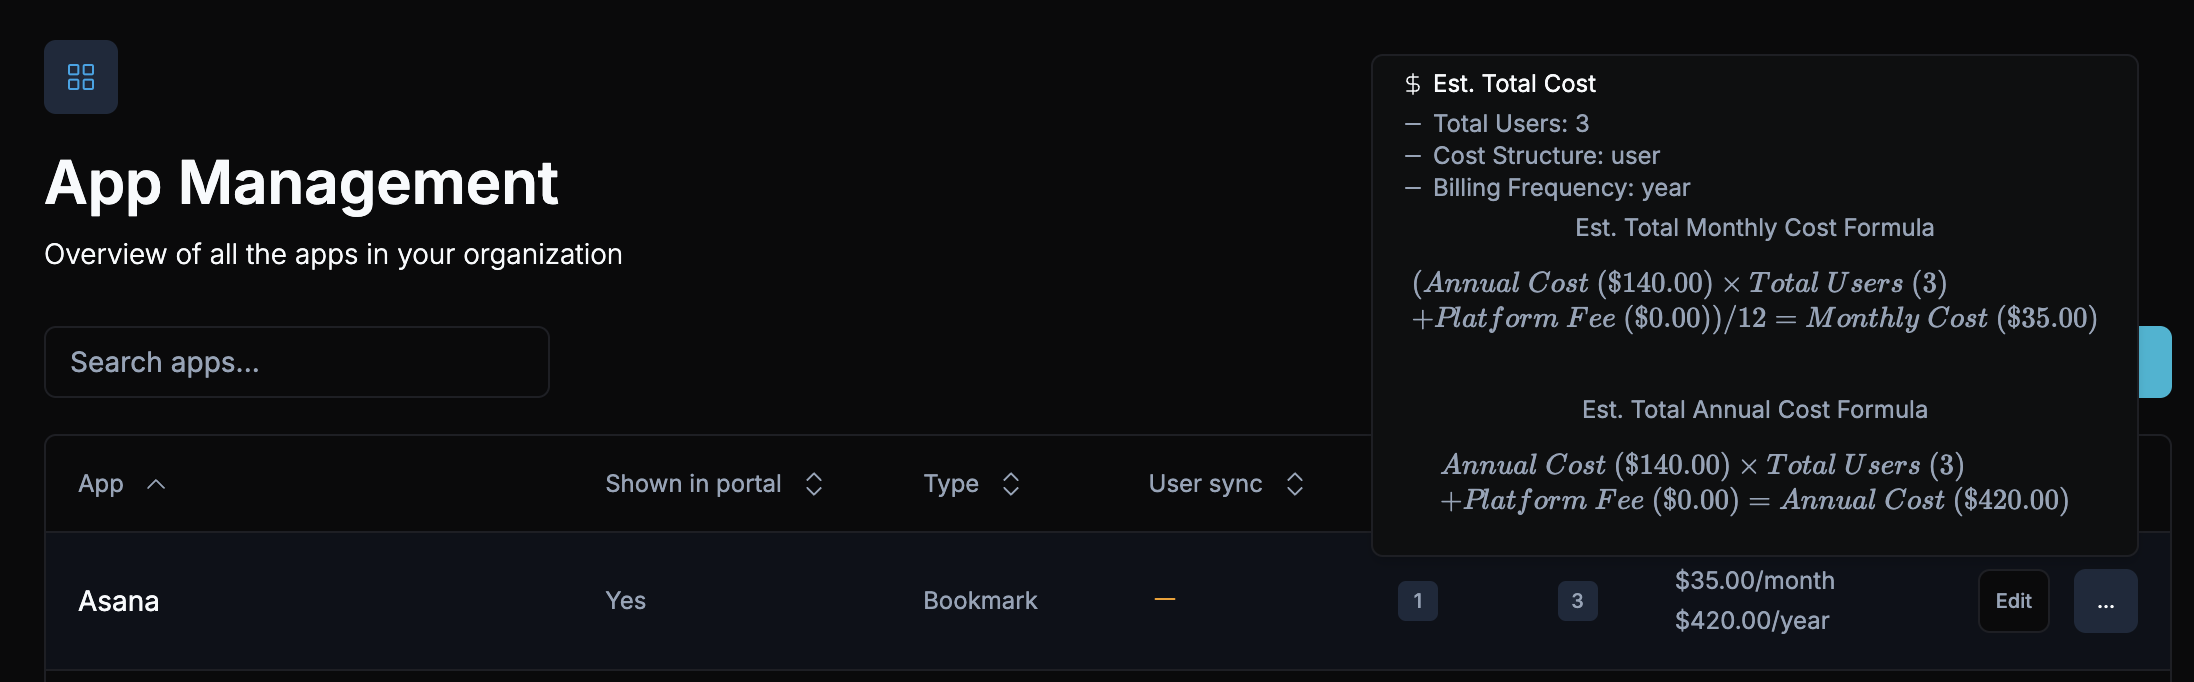
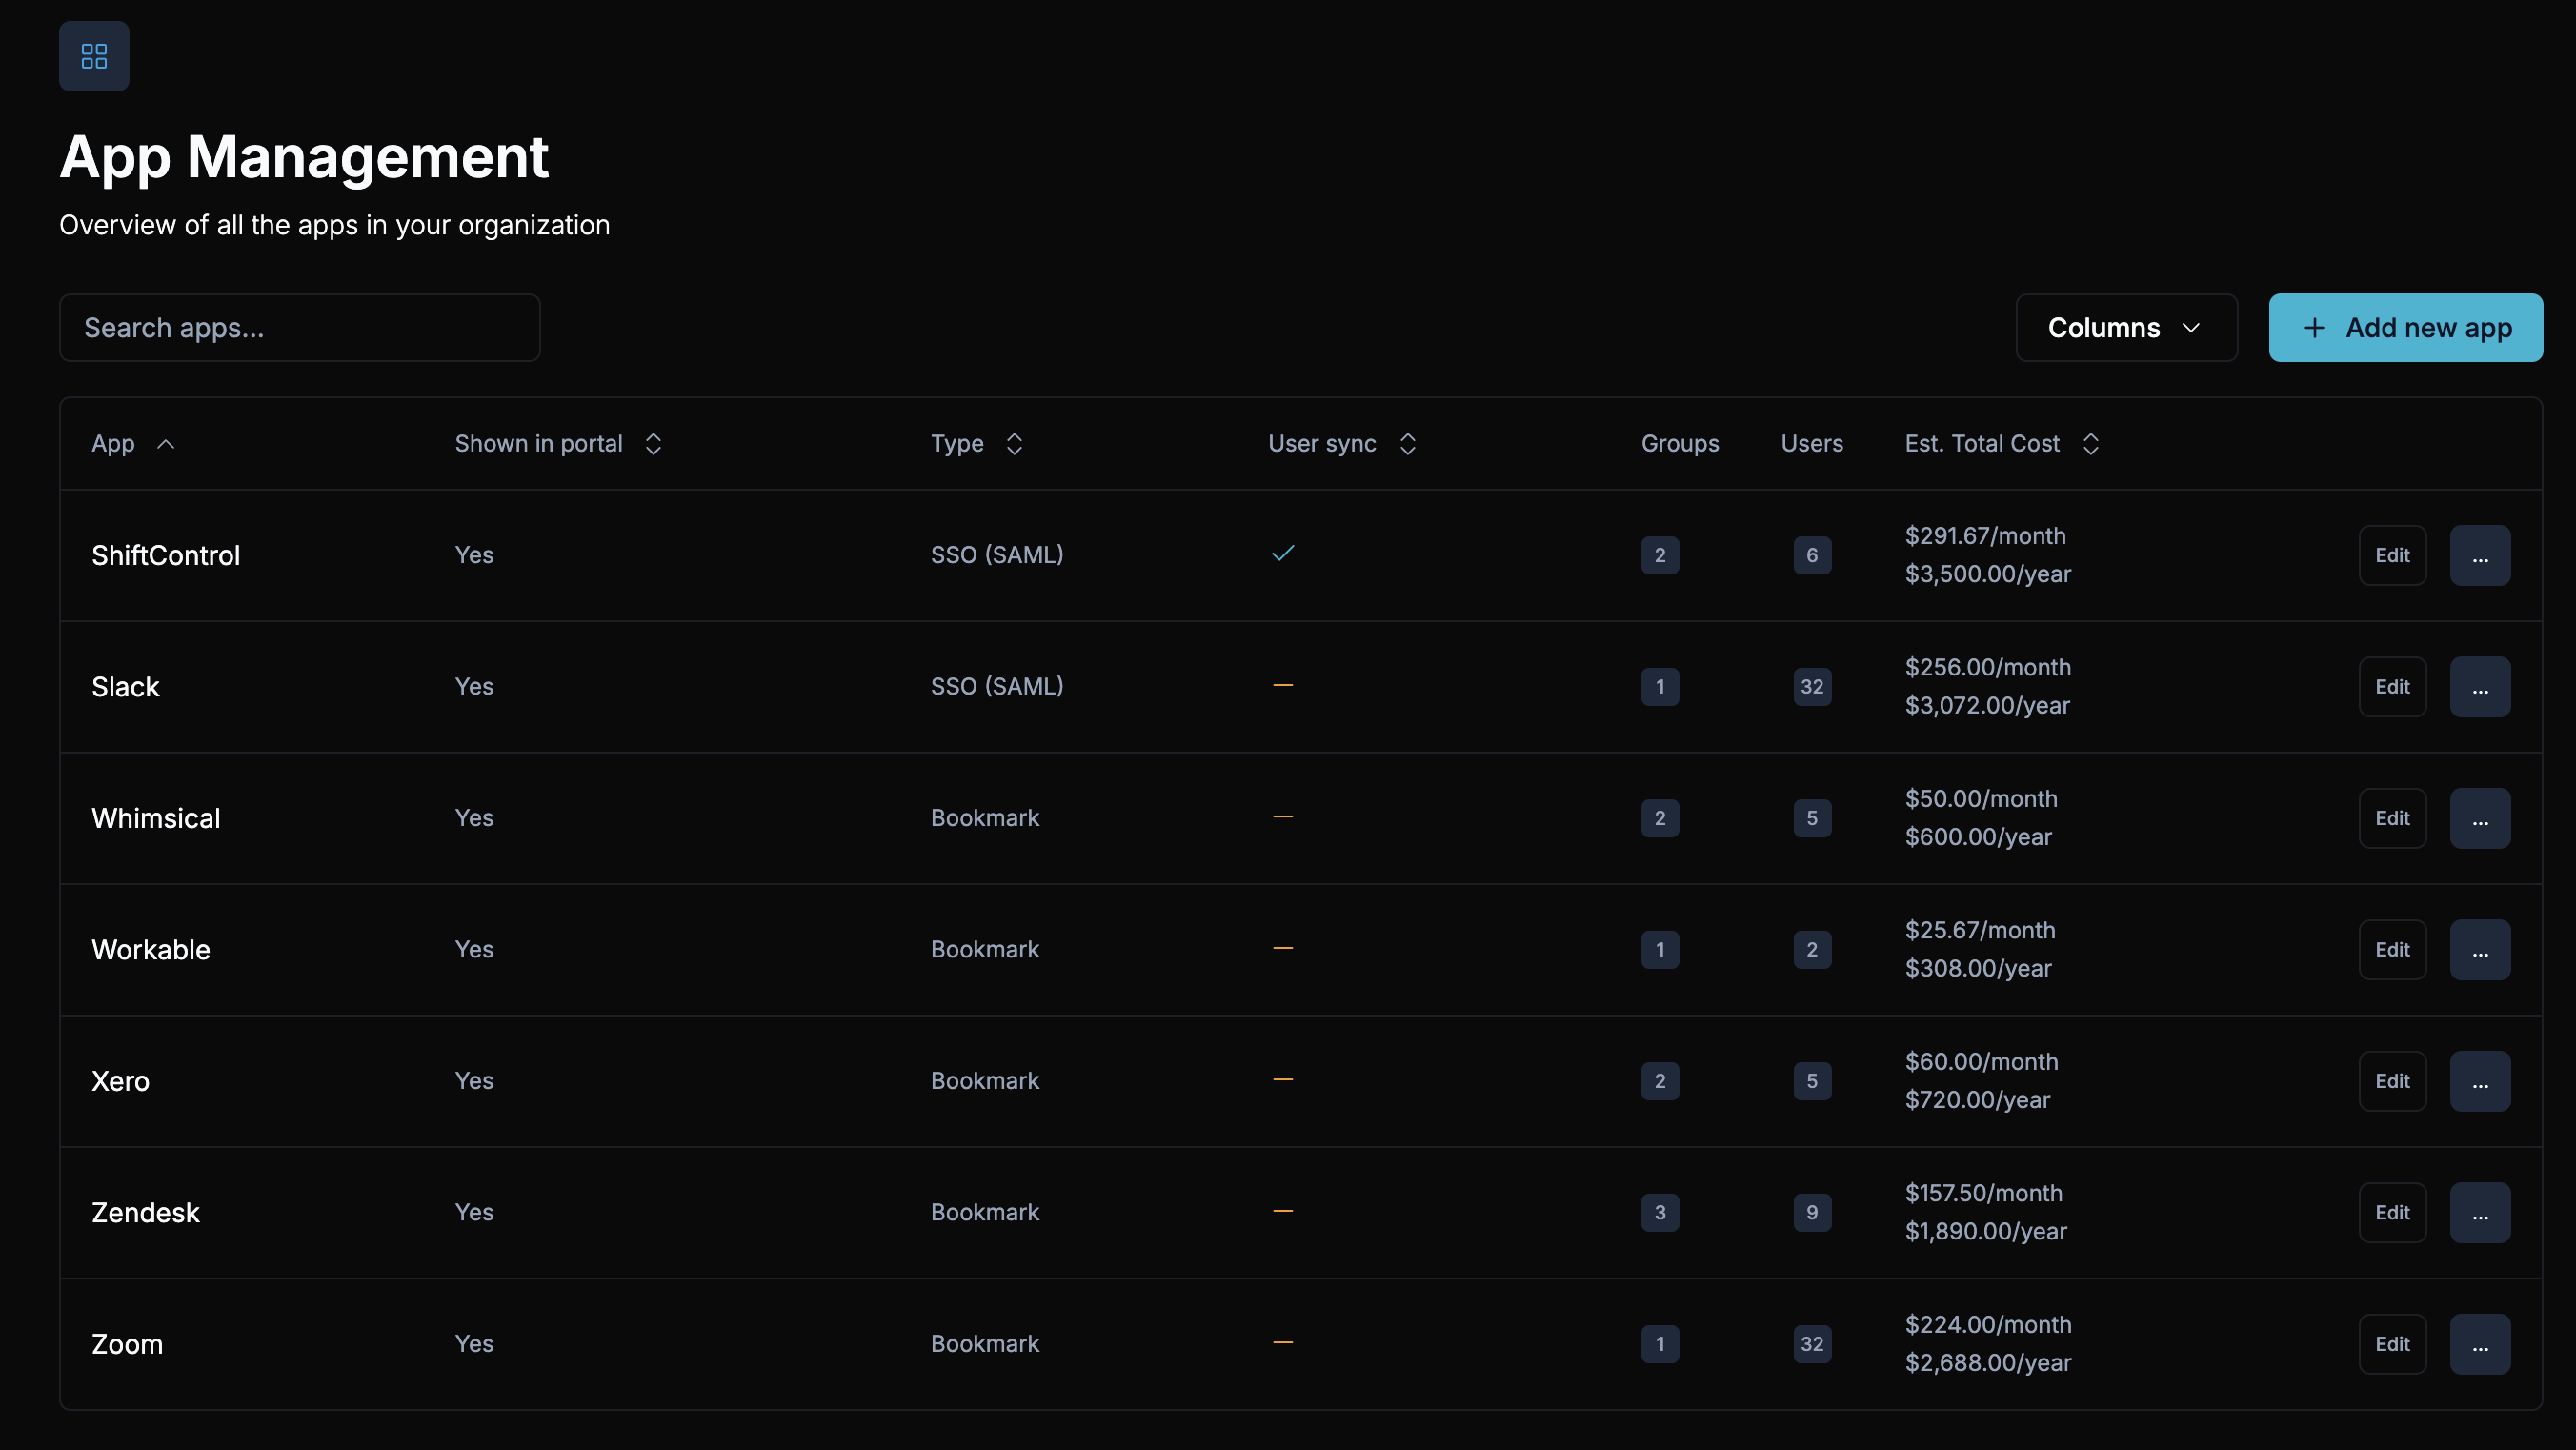
- Your spend math stays clean. Archived apps are excluded from every total and report, so they never inflate or muddy your numbers.
- The cost record stays put. The subscription and cost details are preserved, not deleted.
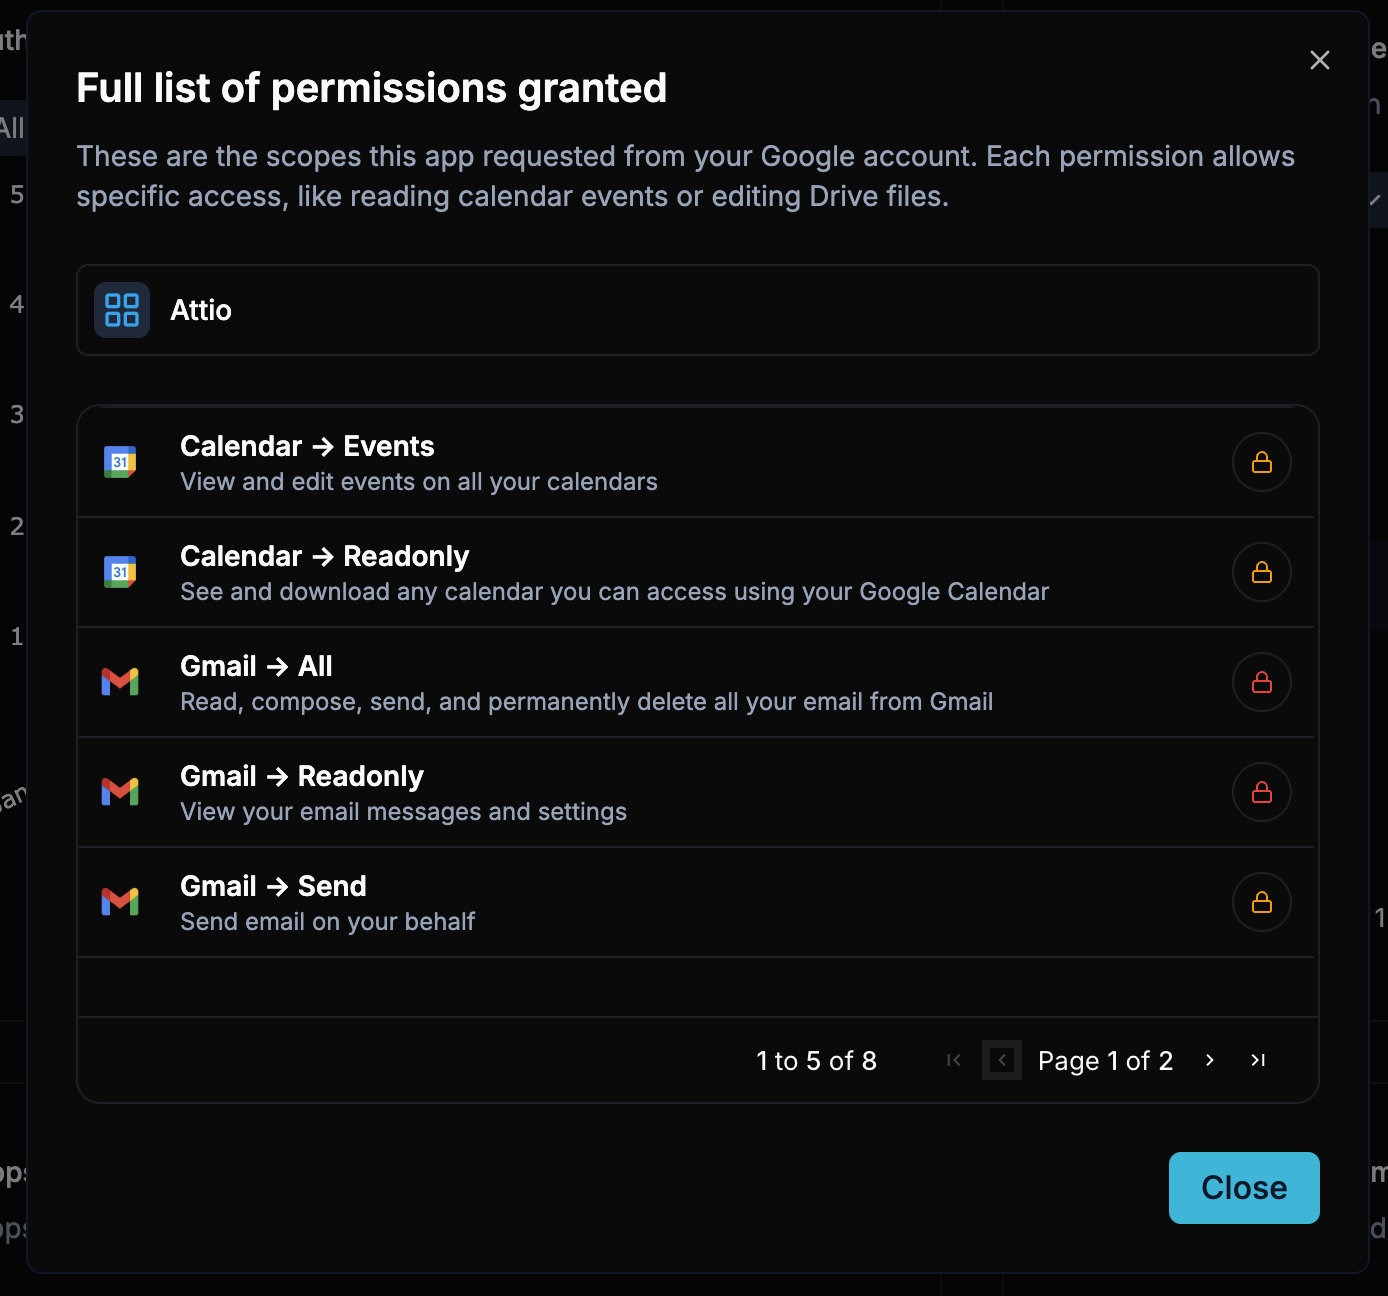
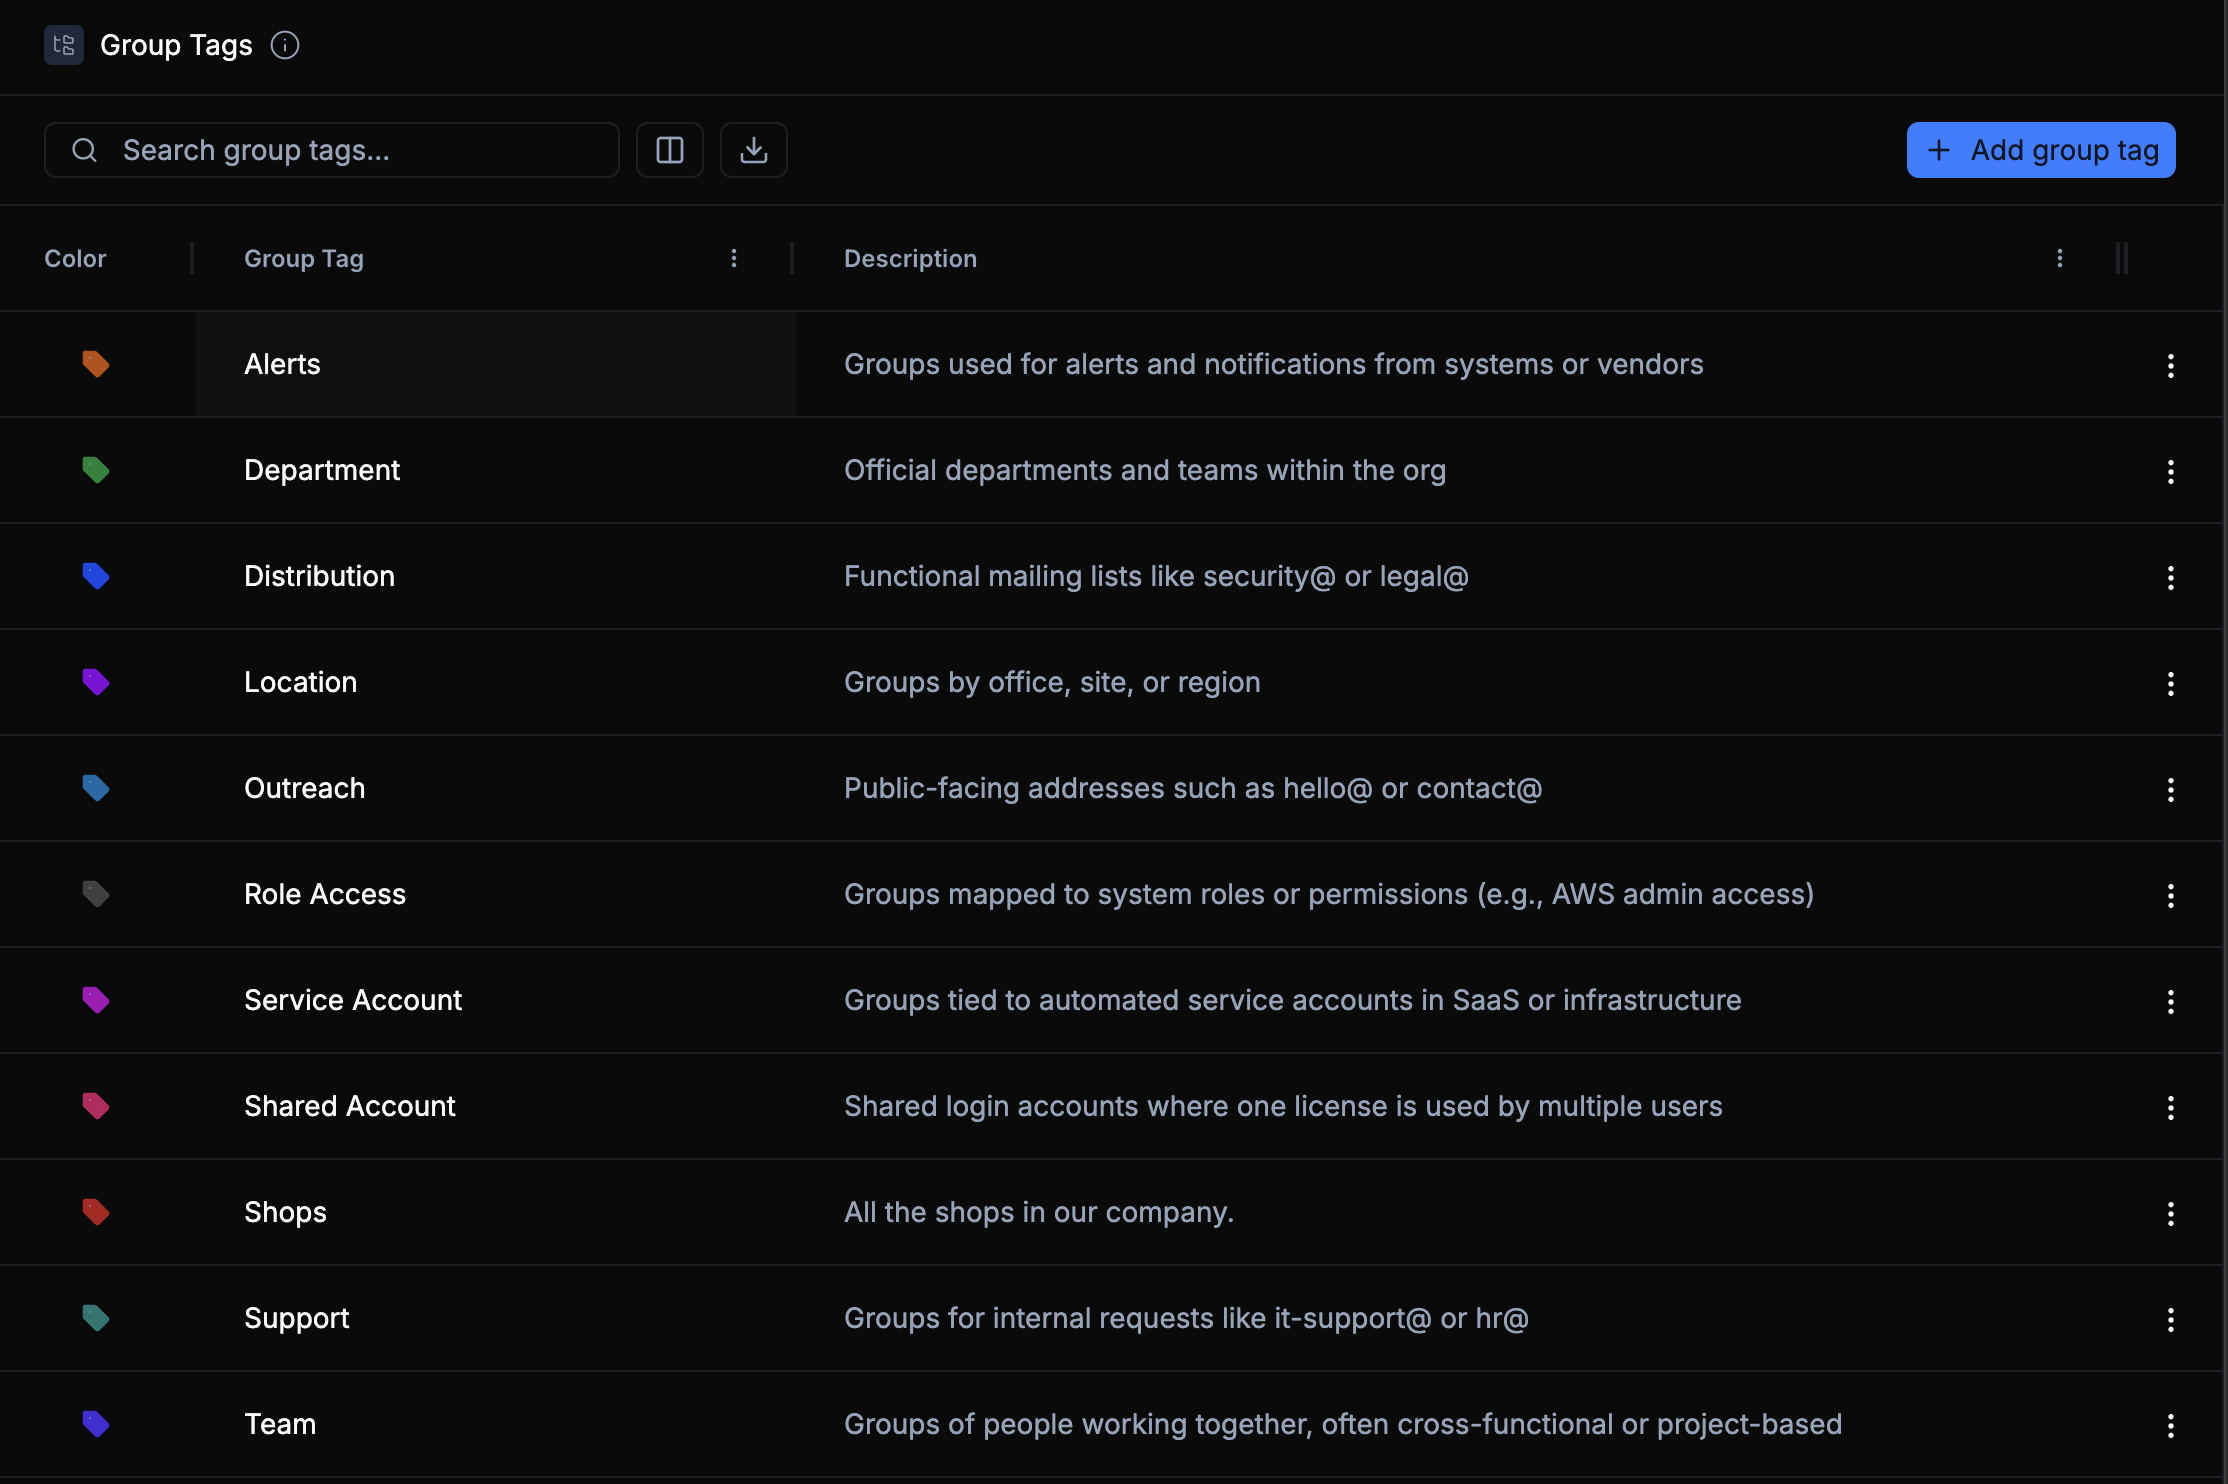
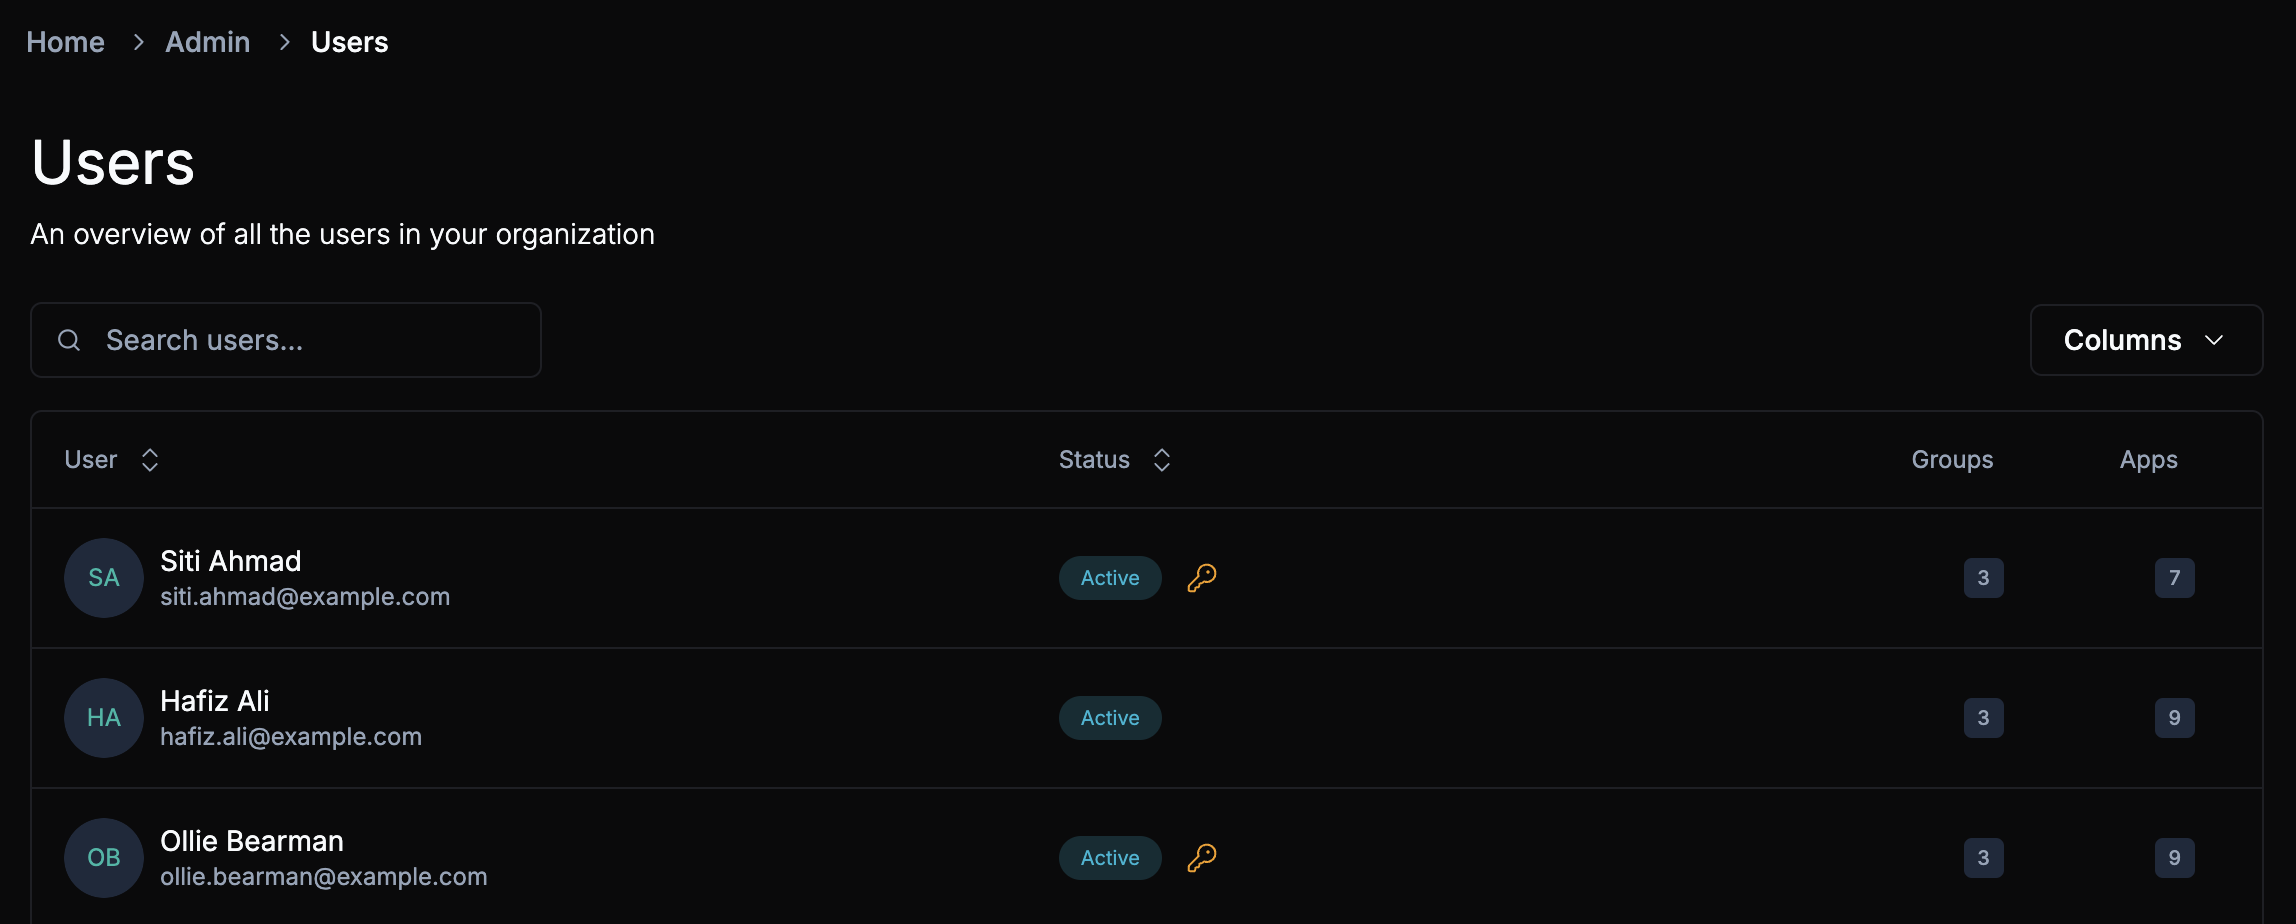
- A read-only home for retired apps. Flip on the admin-only Archived filter to browse anything you’ve retired, including its cost and sign-on details.
- Changed your mind? Un-archive any time. Bring an app back whenever you need it. It returns unassigned, so you’ll just re-assign who gets access.
- Retire in bulk. Archive a whole batch of apps at once instead of one at a time.
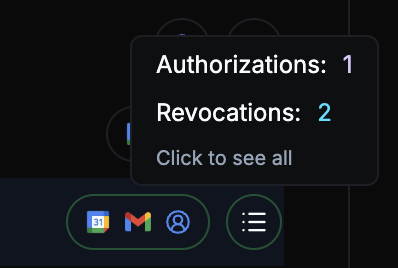
- Always know who and when. Every archive is stamped with the person who did it and the date, so there’s a clear trail.
Getting Started
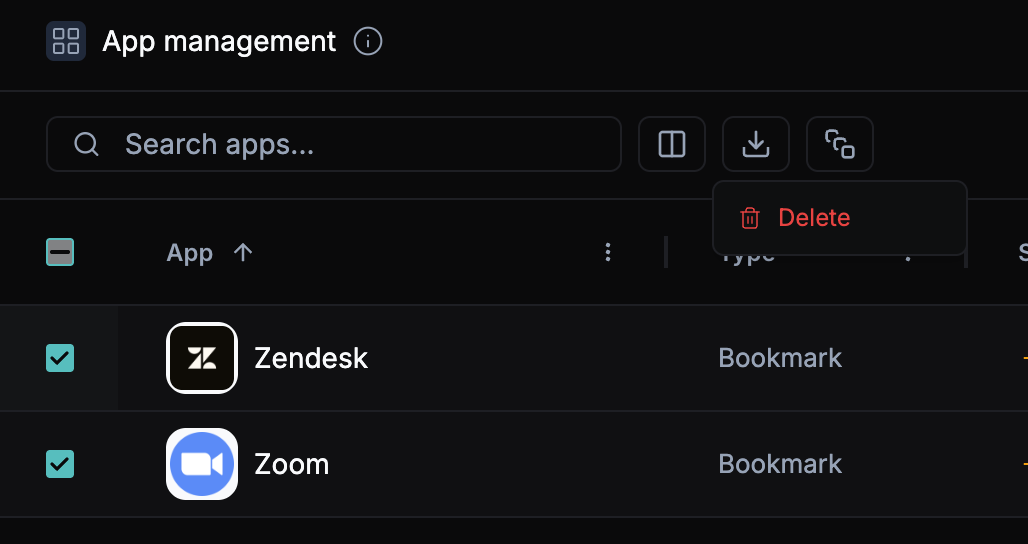
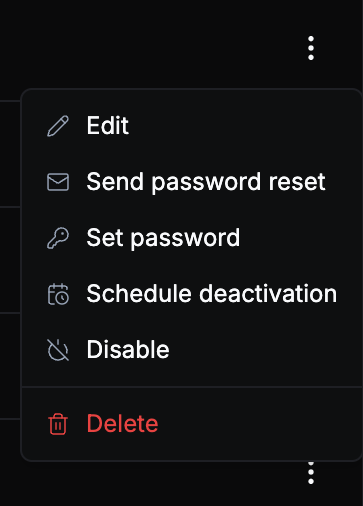
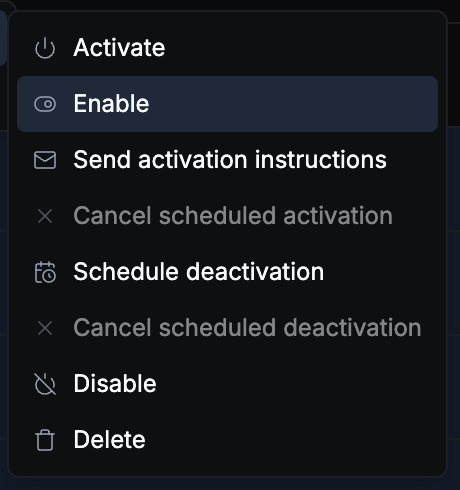
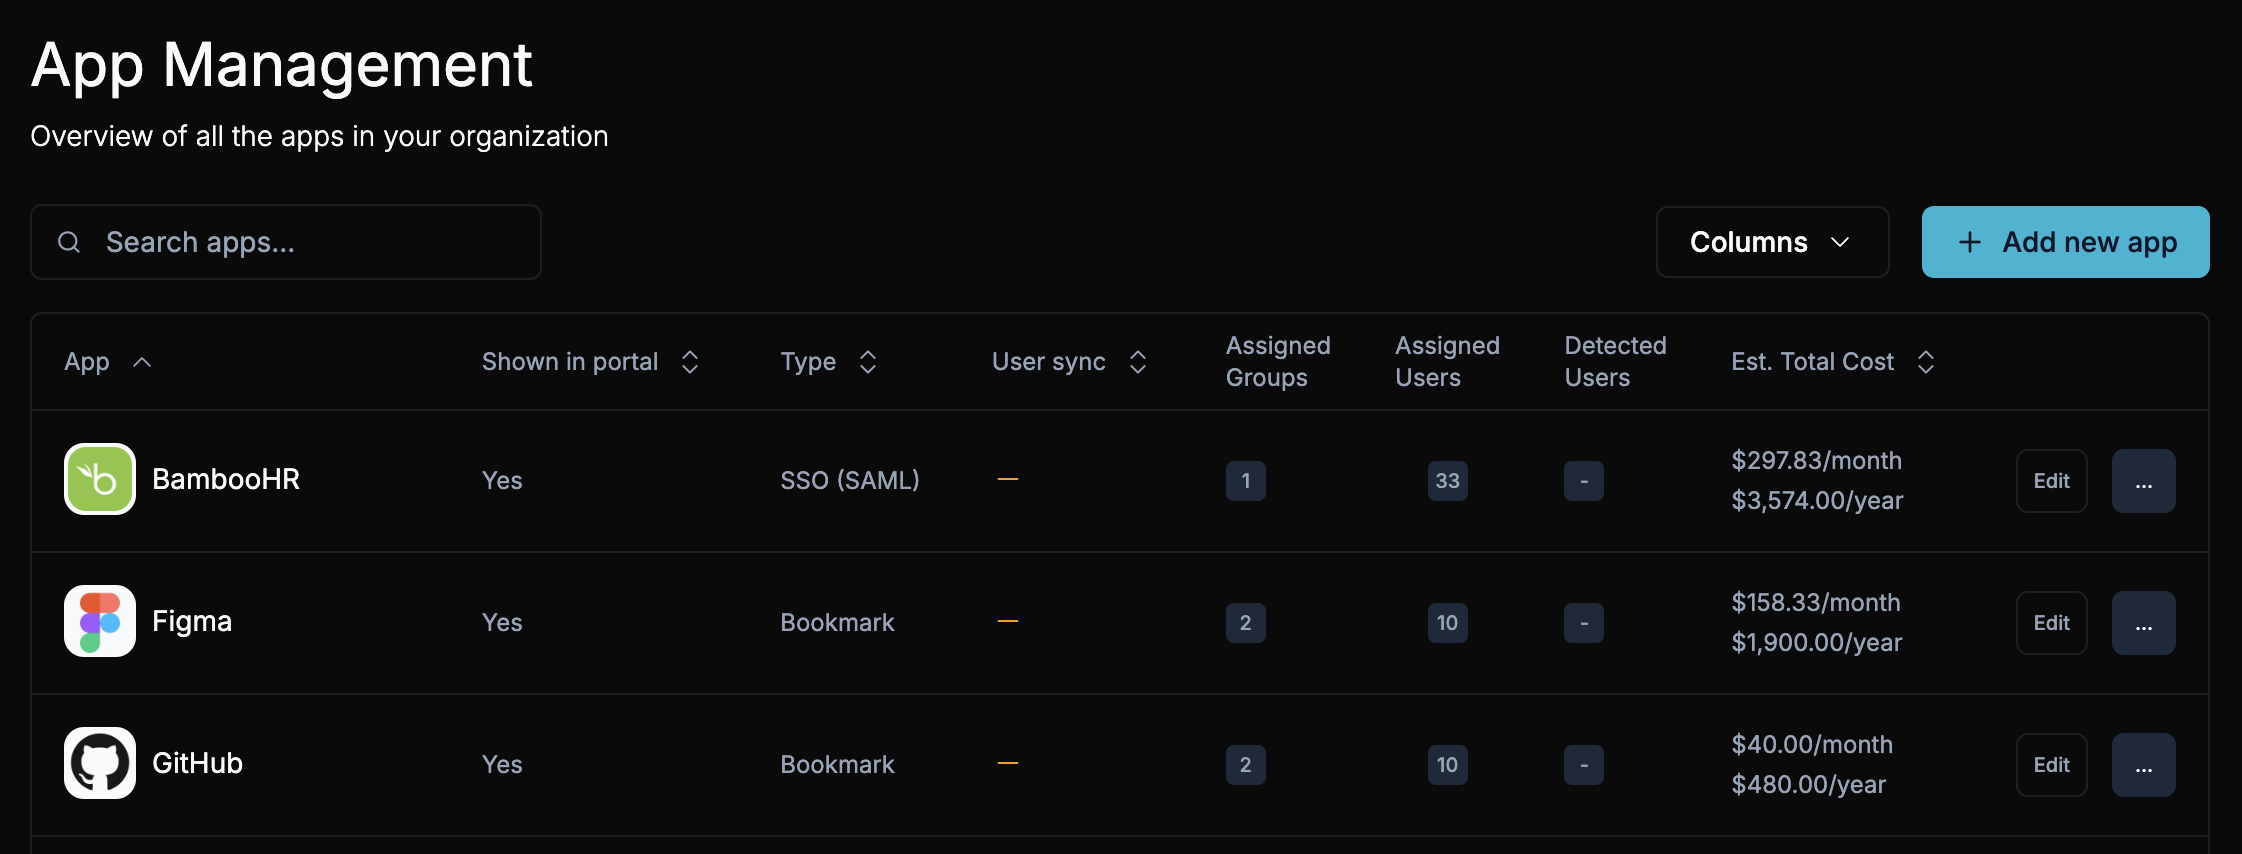
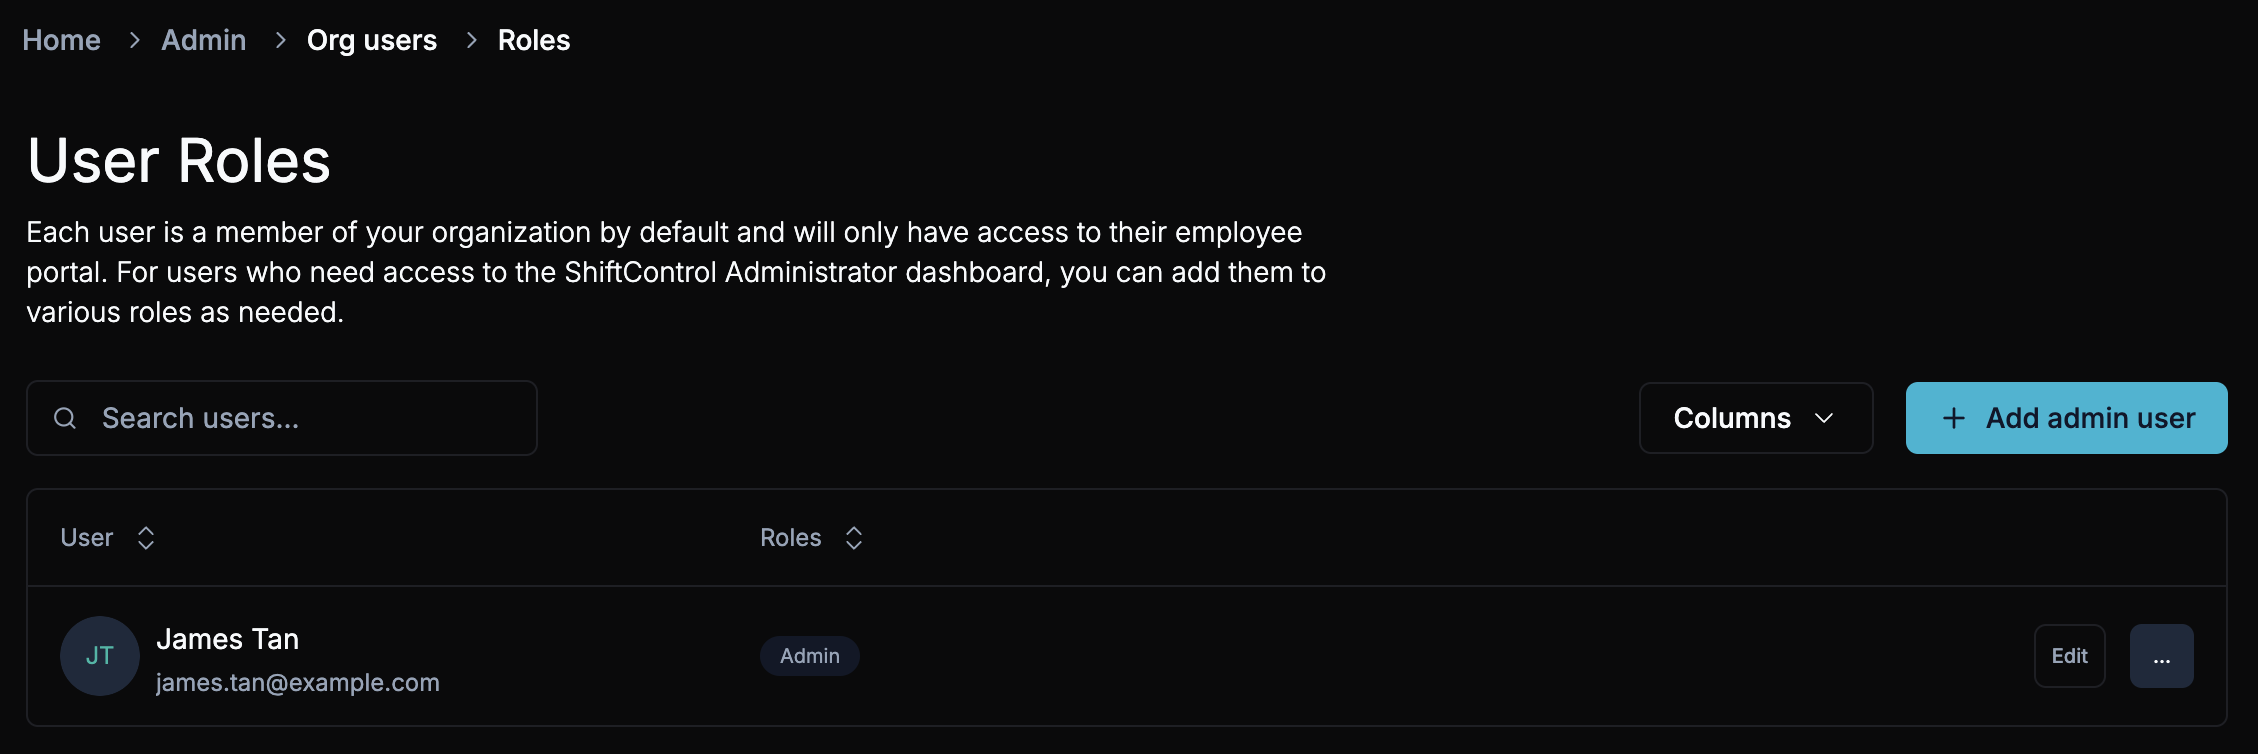
- Open the app you want to retire from Manage Apps.
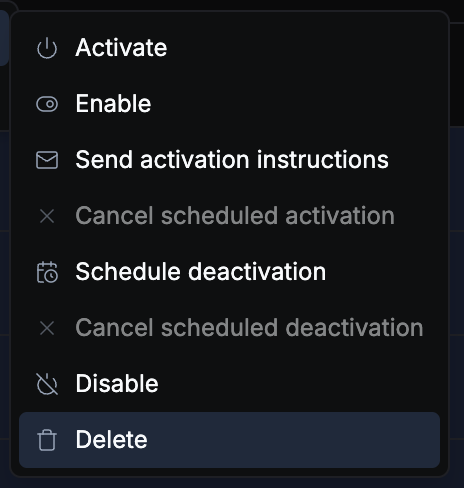
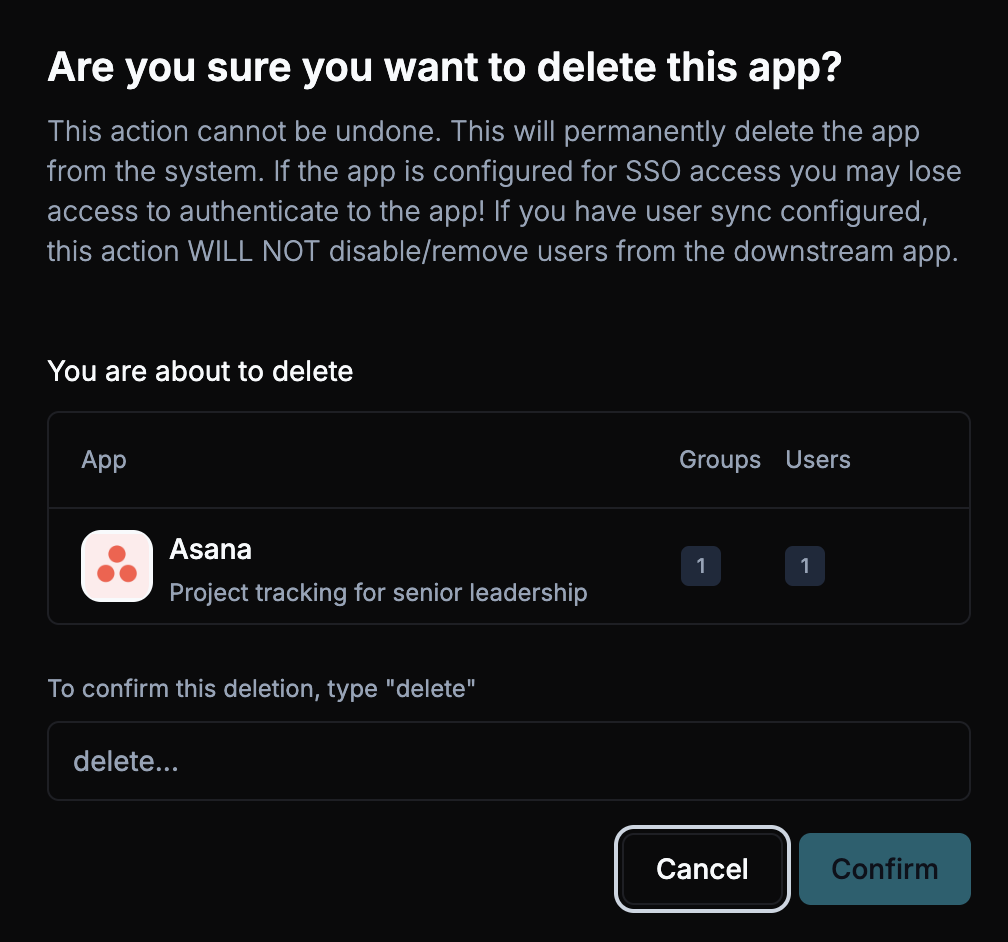
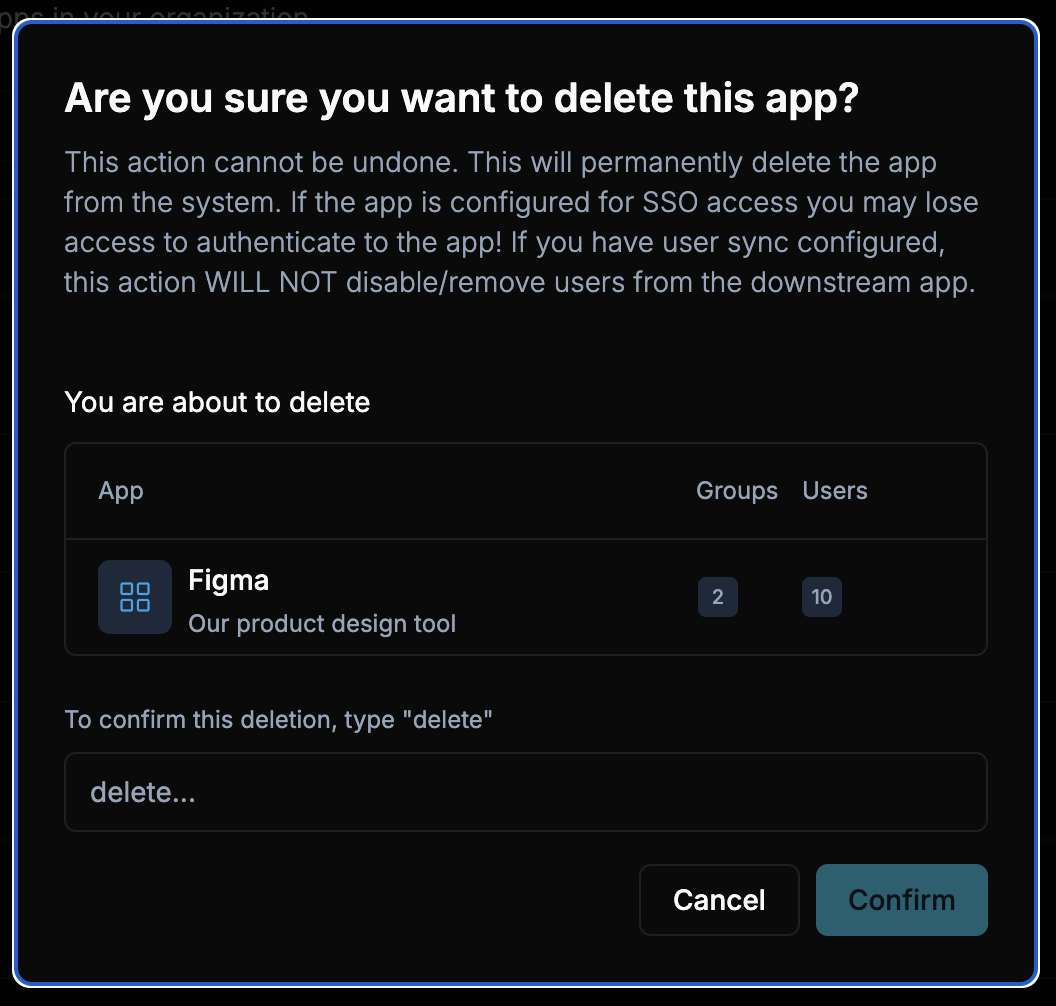
- Choose Archive.
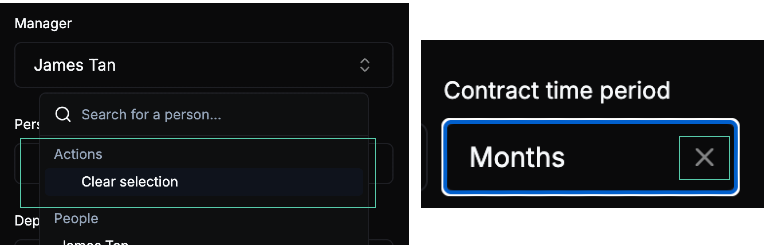
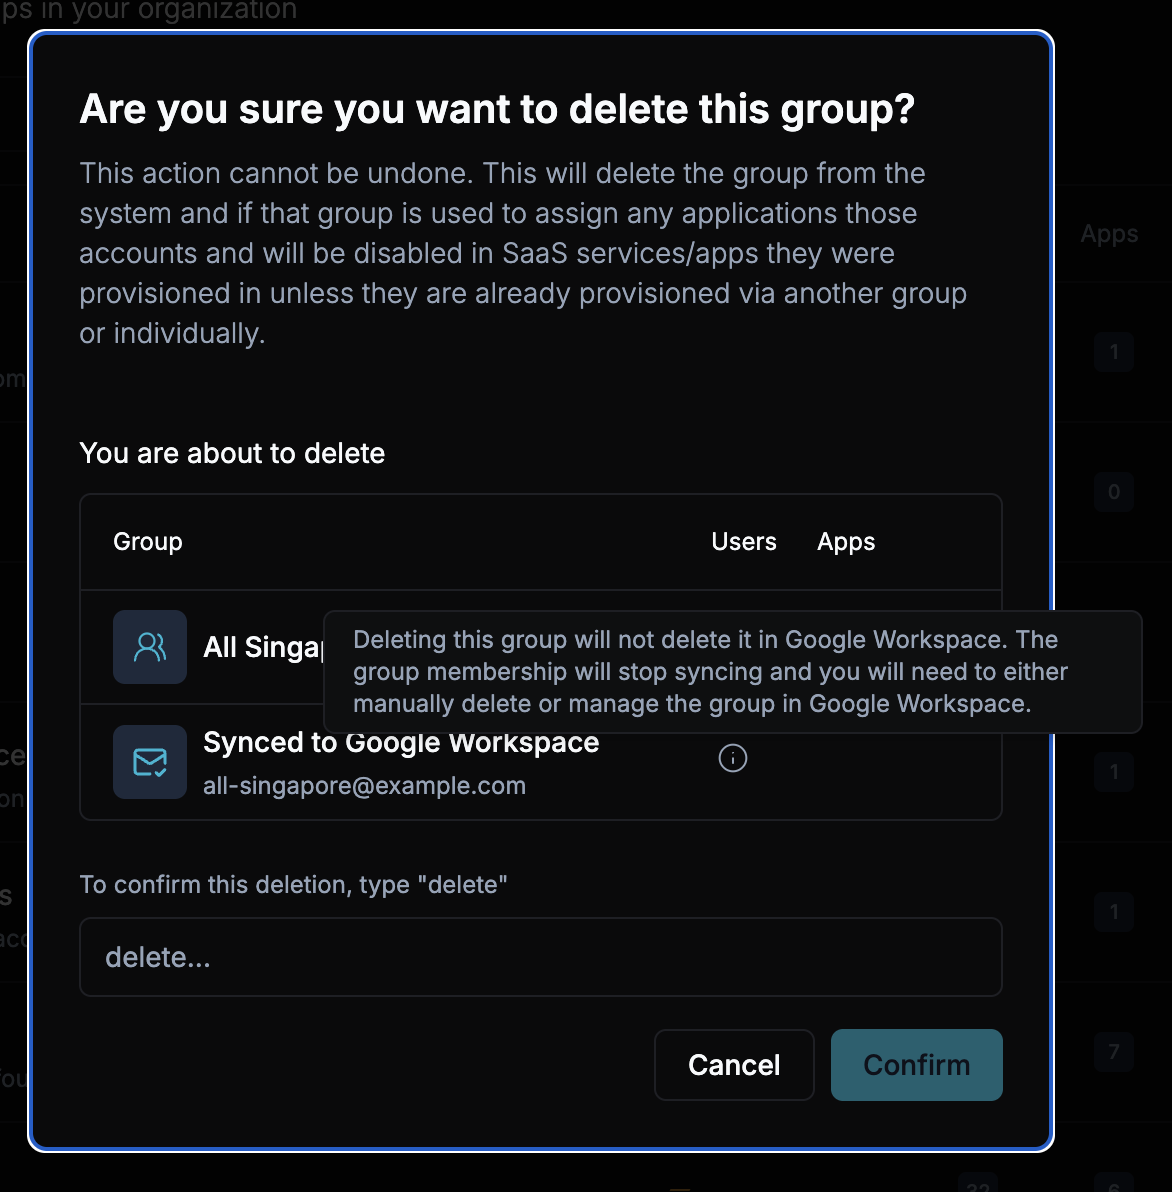
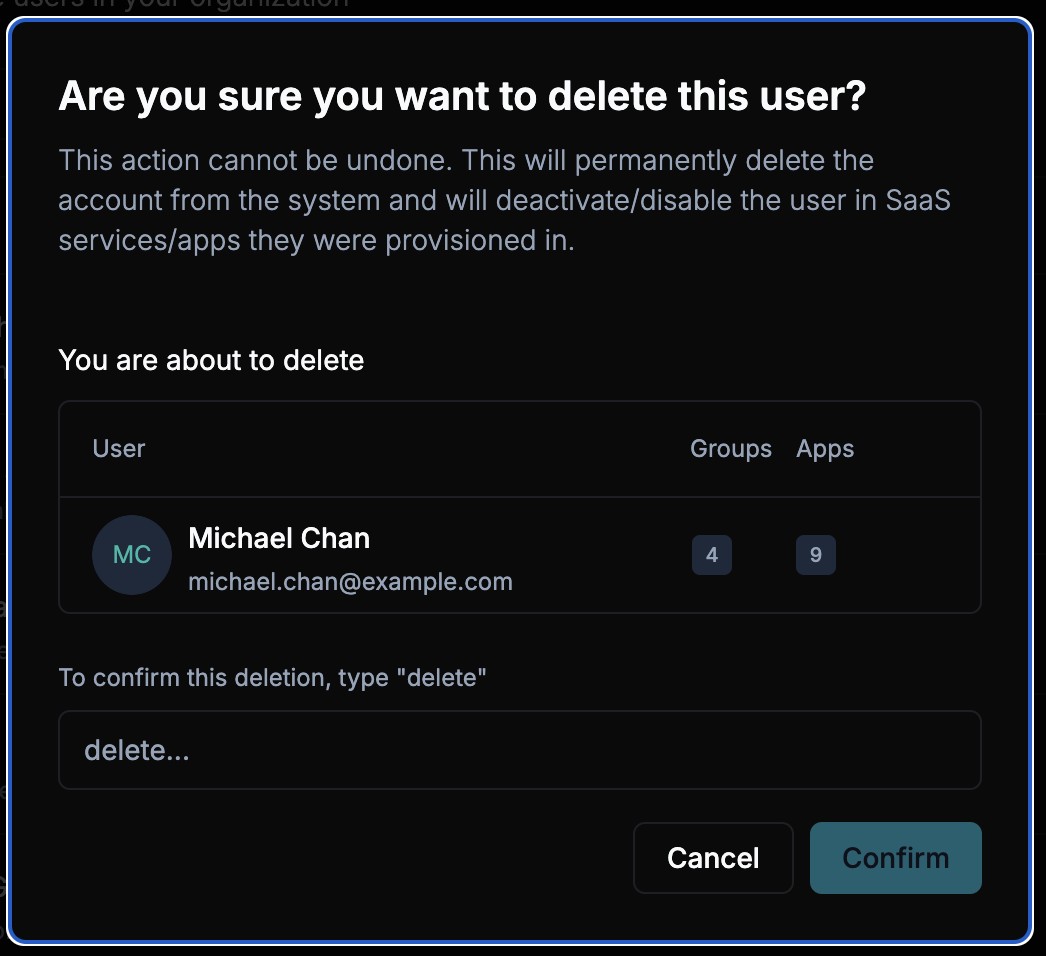
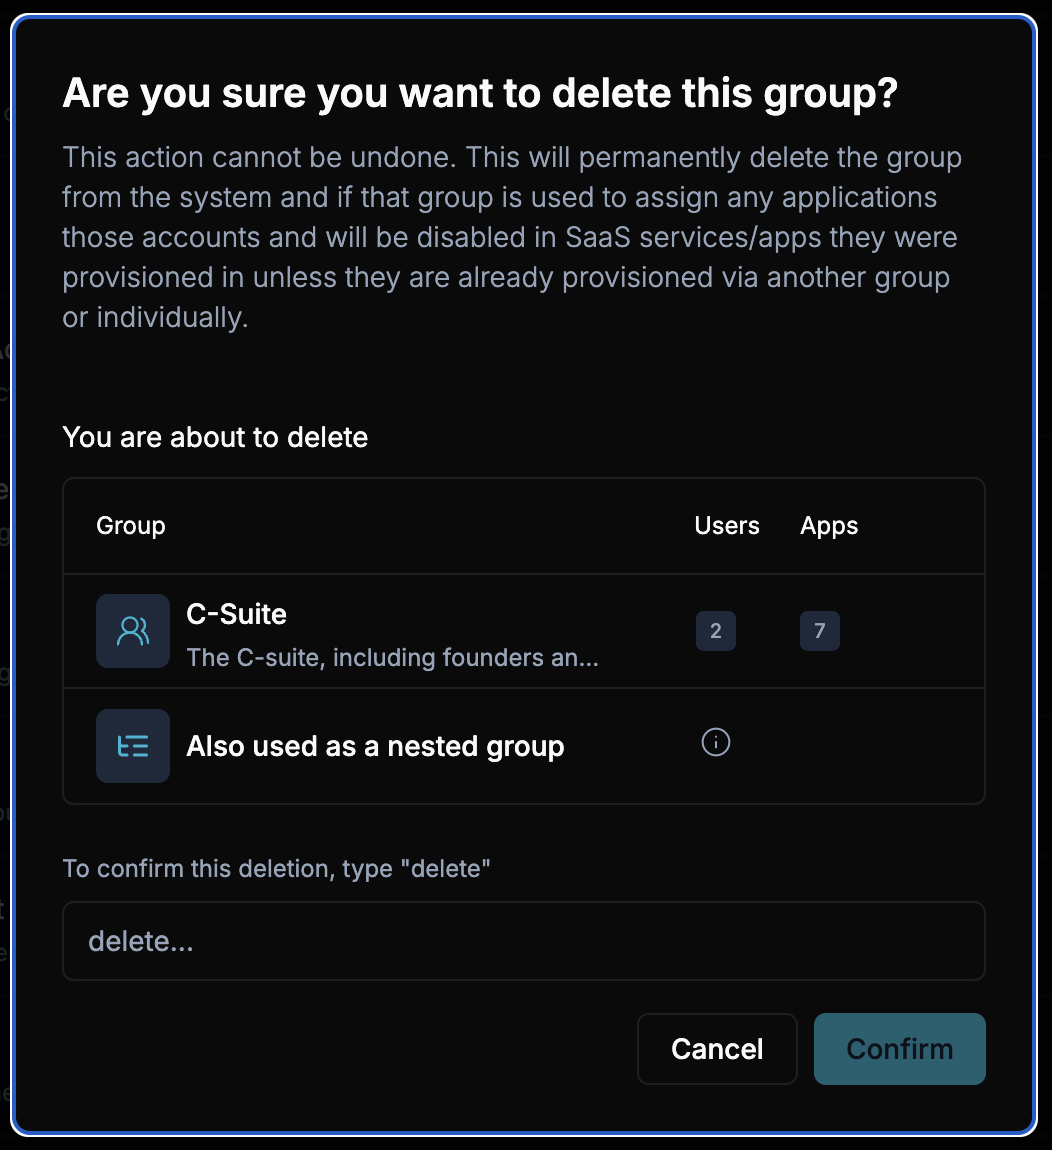
- Confirm in the dialog — same quick confirmation you’d see for a delete.
- Need to look back later? Switch on the Archived filter to view it (and its cost history) any time.
- Want it back? Hit Un-archive, then re-assign access.